
Figure 4.
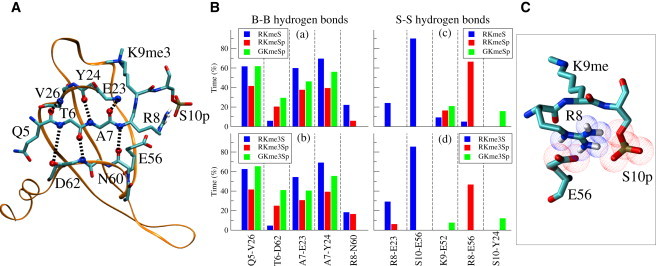
Hydrogen bonding between the H3 oligopeptide and HP1. (A) Hydrogen-bonding pattern in the complex between the H3 oligopeptide and HP1. (B) Vertical bars represent the percentage of time during which hydrogen bonds between backbone atoms (B-B) persist for the various amino acid pairs in (a) the RKmeS (blue), RKmeSp (red), and GKmeSp (green) structures, and (b) the RKme3S (blue), RKme3Sp (red) and GKme3Sp (green) structures. The same notation is used in c and d for the hydrogen bonds between side-chain atoms (S-S). (C) Part of the structure of the complex with the O atoms of phosphorylated S10 and E56 (red) and the N atoms on R8 (blue) shown as van der Waals spheres.