
Figure 5.
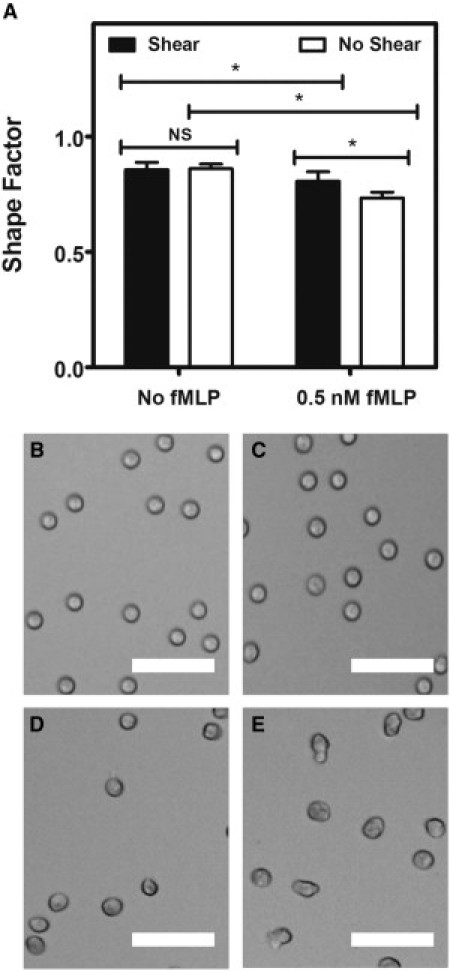
Fluid shear stress alters fMLP-induced neutrophil morphology changes. (A) Shape factor measurements of neutrophils exposed to shear stress or static conditions without and with 0.5 nM fMLP stimulation. (B–E) Brightfield images of neutrophils exposed to shear stress or static conditions without fMLP (B and C, respectively), and neutrophils exposed to shear stress or static conditions with 0.5 nM fMLP (D and E, respectively). All scale bars = 50 μm. n = 3 donors, with 300 neutrophils analyzed for shape factor for each donor condition. Error bars represent 95% confidence intervals. ∗P < 0.05 for all measurements.