
Figure 5.
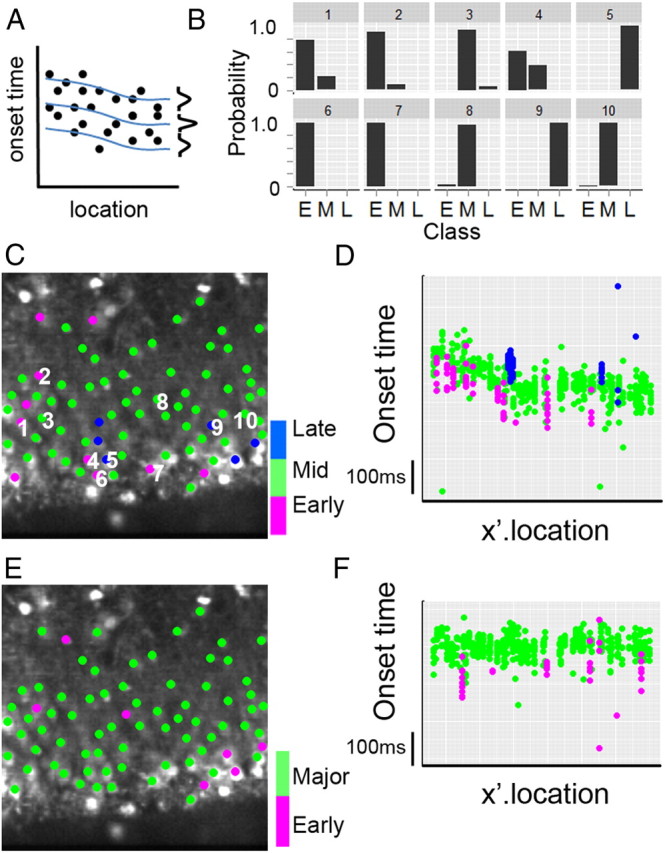
Latent class model analysis of cell activation latencies during bursts. A, Schematic illustration of LC analysis with a class-specific linear mixed model. Onset time was fit to class-specific spline curves without changing the shape but shifting intercept in a class-specific manner. Vertical bell-shaped distributions at the right end of each line are class-specific Gaussian distributions. LC analysis was conducted for different number of classes (from one to six); adjBIC values were calculated for each scenario, and the scenario expressing the minimum adjBIC was selected as the optimum number of classes. LC analysis found three classes as the best-fitting model for GDPs. B, Bar graphs of posterior probability of class membership for 10 representative cells (location shown in C) for the three class model, with E (early group), M (middle group), and L (late group). Cells were then assigned to a particular class based on their maximum posterior probability. C, Color-coded class assignment (early, red; middle, green; late, blue) superimposed on the image with the label for 10 cells shown in B. D, Scatter plots of onset time versus x′ location for all cells for nine type I burst responses with the class assignment in color (codes as in C). E, LC analysis of evoked bursts. Note that different groups of cells comprise the early group for evoked bursts compared with spontaneous GDP bursts (C). F, Scatter plots of onset times versus x′ location for all cells for nine evoked bursts with class assignment in color (early, red; major, green).