Fig. 2. Expression of adipogenic key markers in MEFCAIII+/+, MEFCAIII+/− and MEFCAIII−/−.
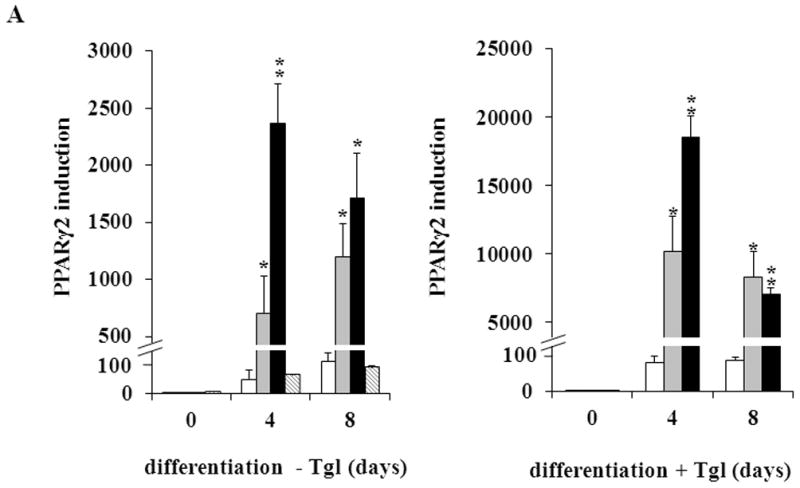
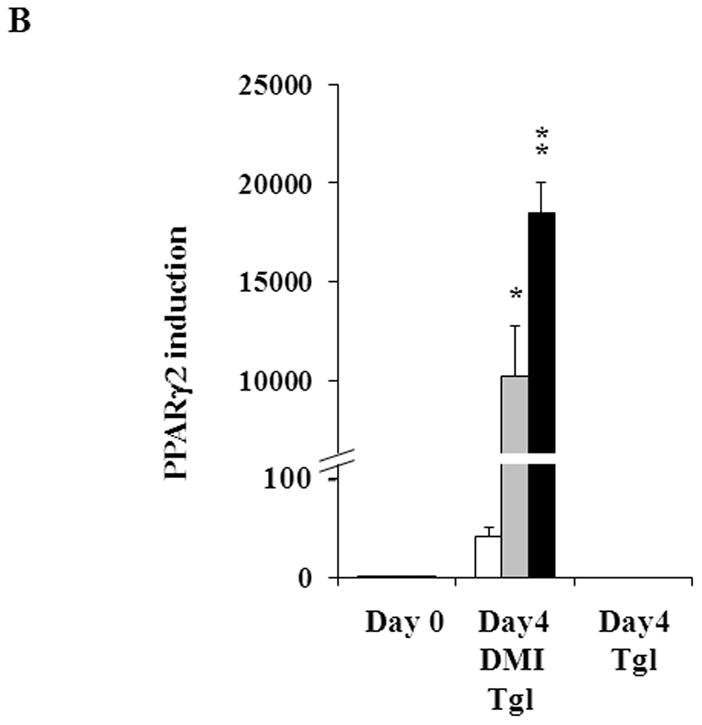
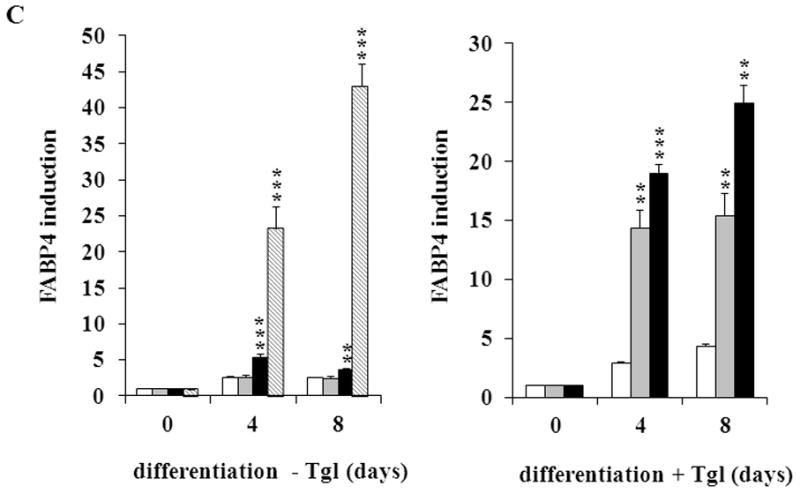
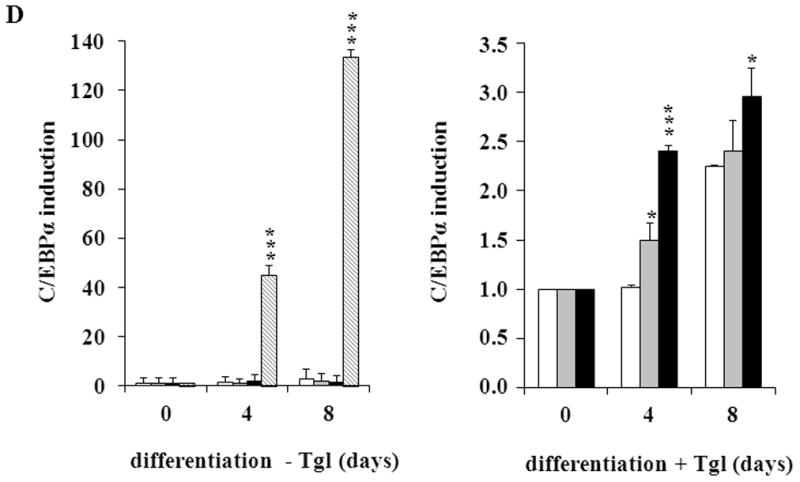
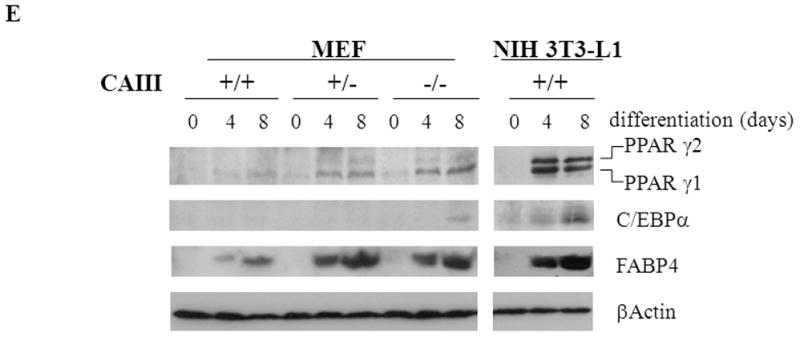
(A) MEFs were exposed to hormone-cocktail to induce adipogenesis for 8 days, either in the presence or absence of the PPARγ2 activator troglitazone (Tgl), as indicated. Q-RT-PCR analysis was performed at days 0, 4 and 8 of differentiation in MEFCAIII+/+ (white columns), MEFCAIII+/− (grey columns), MEFCAIII−/− cells (black columns), and NIH 3T3-L1 (diagonal-striped columns) for the adipogenic key markers PPARγ2. (B) MEFs were exposed to troglitazone (Tgl) without hormone-cocktail (DMI). Q-RT-PCR analysis of PPARγ2 was performed at day 4 after addition of Tgl in MEFCAIII+/+ (white columns), MEFCAIII+/− (grey columns), and MEFCAIII−/− cells (black columns). PPARγ2 expression in MEFCAIII+/+ (white columns), MEFCAIII+/− (grey columns), and MEFCAIII−/− cells (black columns) exposed to hormone-cocktail (DMI) and Tgl at day 4 of differentiation is shown for comparison. (C and D) The MEFs were exposed to hormone-cocktail to induce adipogenesis for 8 days, either in the presence or absence of troglitazone (Tgl), as indicated. Q-RT-PCR analysis was performed on days 0, 4 and 8 of differentiation in MEFCAIII+/+ (white columns), MEFCAIII+/− (grey columns), MEFCAIII−/− cells (black columns), and NIH 3T3-L1 (diagonal-striped columns) for FABP-4 (C), and C/EBPα (D). Data are presented as the mean +/− SD of 3 measurements, (*) p ≤ 0.05; (**) p ≤ 0.01; (***) p ≤ 0.001. (E) Western blot of differentiated MEFCAIII+/+, MEFCAIII+/−, MEFCAIII−/−, and NIH 3T3-L1 cells (days 0, 4 and 8) was performed as indicated, using antibodies against the adipogenic markers, PPARγ1 and 2, C/EBPα, and FABP-4. β-Actin served as a loading control. One representative set of western blots of three independent western blot experiments is shown.
