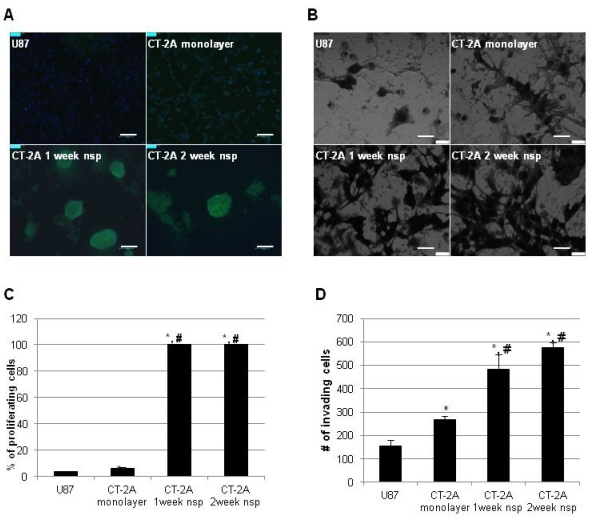
Figure 4.
CT-2A neurospheres are highly proliferative and invasive in vitro. A) Immunofluorescence photomicrographs after BrDU incorporation (green) showing stronger incorporation consistent with increased proliferation in CT2A neurospheres compared to CT2A and U87 monolayer cells (Alexa488 green, DAPI blue). B) Phase contrast photomicrographs of an in vitro invasion assay showing that CT-2A neurospheres were more invasive than CT-2A and U87 monolayer cells (Hema3 stain). A: magnification, 10x; scale bar 100 μm. B: magnification, 40x; scale 400 μm. C and D) Bar graphs quantifying the above results confirm a statistically significant increase in both proliferation (C) and invasion (D) in the CT-2A neurospheres compared to the CT-2A and U87 monolayer cells. Data reported as mean ± SD (#p<0.05 compared to U87, * p<0.05 compared to CT-2A, per Student's t-Test).

