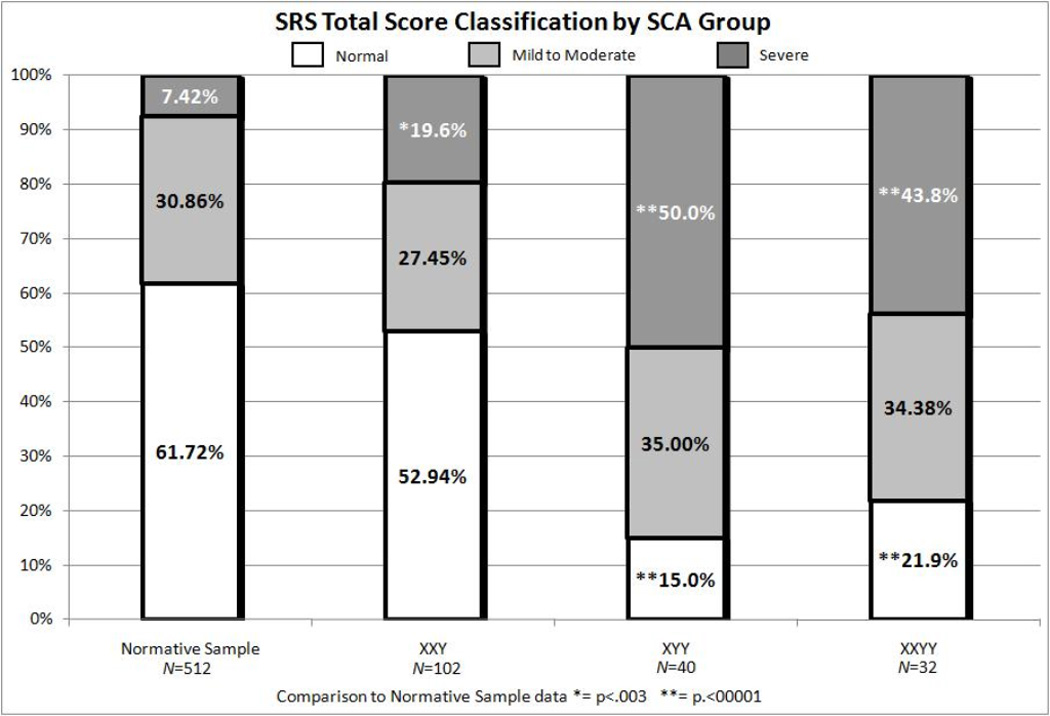
Figure 2.

Proportions of XXY, XYY and XXYY groups with social responsiveness scale total tscores in the normal, mild to moderate, and severe ranges compared to the normative sample.

Proportions of XXY, XYY and XXYY groups with social responsiveness scale total tscores in the normal, mild to moderate, and severe ranges compared to the normative sample.