
Figure 4.
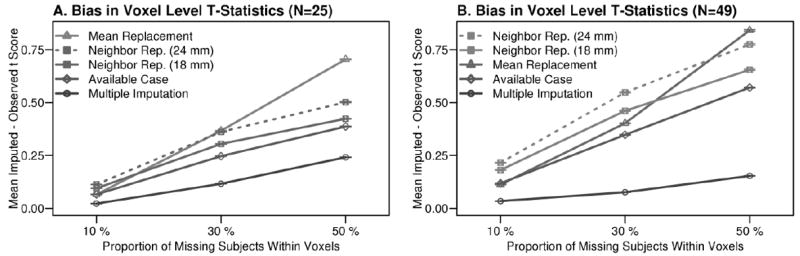
Bias in the t-statistic results for each missing data method was estimated by direct comparison with simulated-complete results. Specifically, the absolute value of difference in the imputed and observed t-statistic in small (N = 25) and large (N = 49) simulated datasets was pooled across voxels, as a function of proportions of missing data. Each method yielded increased t-statistic differences relative to the complete dataset when the proportion of missing subjects increased, although multiple imputation was less susceptible to that trend compared to the other methods as evidenced by its slope. Multiple imputation also provided the best approximation of the t-statistic obtained using simulated-complete datasets, which is demonstrated by the smallest t-statistic differences for multiple imputation compared to the other missingness strategies.