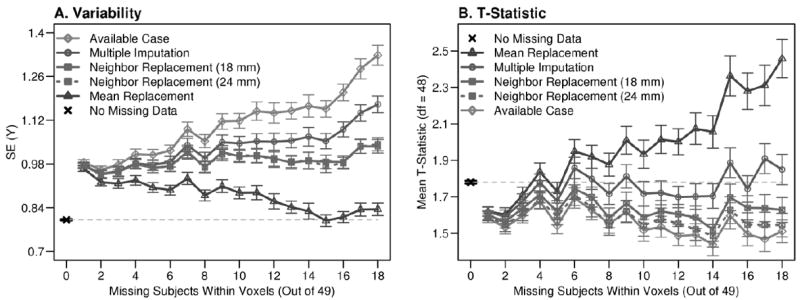
Figure 8.

Results for each missing data replacement strategy by the amount of missing data. A) Variability was estimated using the SE for imputed and non-missing voxel datasets. Mean variability is organized by the number of missing subjects and error bars designate the SE of that estimate. B) Mean t-scores were also calculated across the imputed voxels, and are shown with SE error bars reflecting the variability in the t-scores. A systematic change in variability and t-scores was observed for the available case and mean replacement methods as the number of missing subjects increased, which is consistent with the biases demonstrated using the bootstrap simulation. The neighbor replacement and multiple imputation strategies yielded relatively stable results with respect to missingness.
