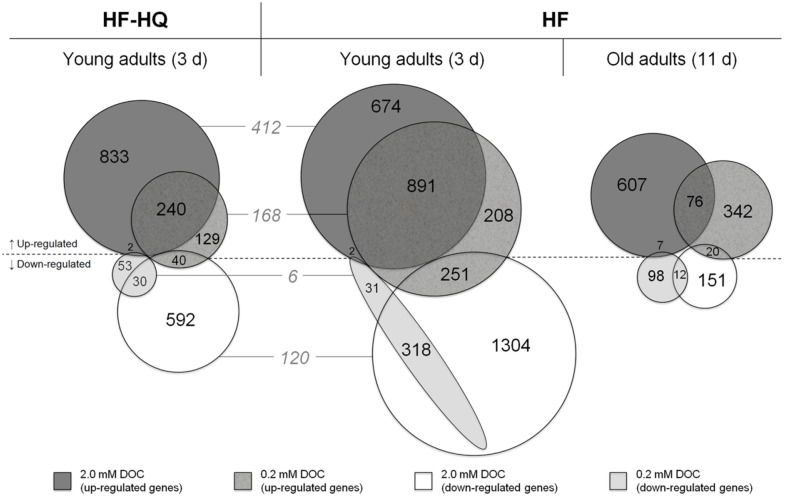
Figure 1.
Over-represented genes. The Venn diagrams show the overlap of significantly up- or down-regulated genes (fold change >1.25 or <0.8) per concentration in nematodes exposed for 3 days to HF (center), HF-HQ (left), and for 11 days to HF (right). The gray colored numbers given in italics represent the overlap between HF and HF-HQ derived DEG lists.

