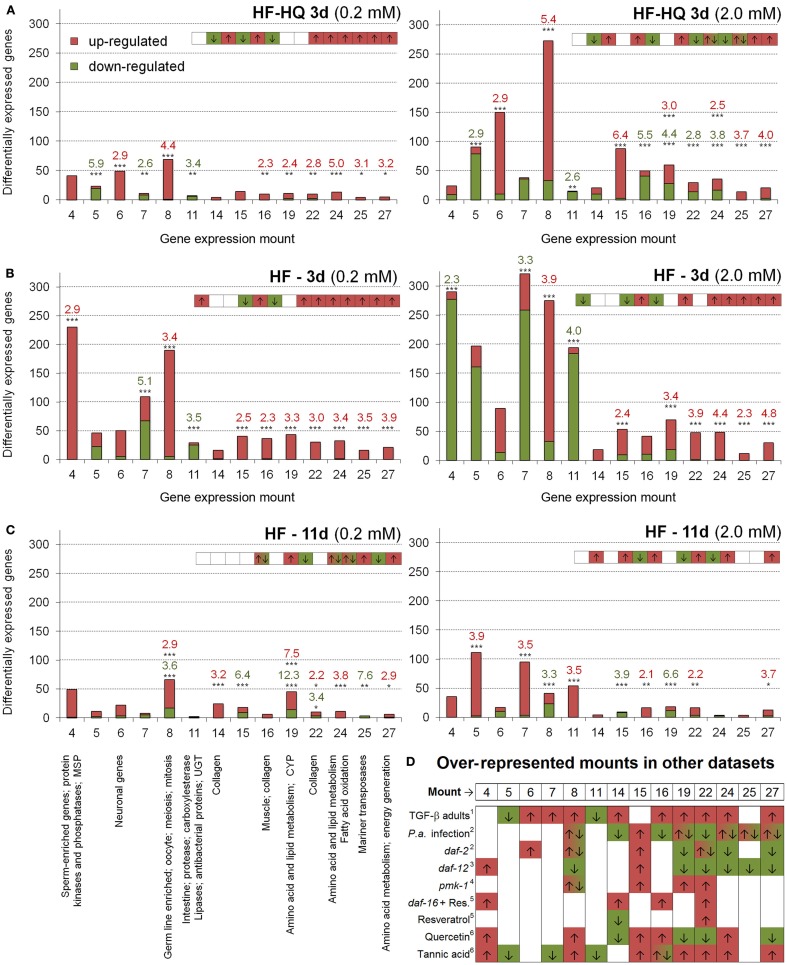
Figure 2.
Over-represented gene expression mountains. Identification of over-represented gene expression mountains of (A) HF-HQ (3 days), (B) HF (3 days), and (C) HF (11 days) treated nematodes; 0.2 mM DOC data are shown on the left, 2.0 mM data on the right. Only mounts which are significantly affected by at least one HS treatment are presented, red labels represent up-, green labels down-regulated genes. *P < 0.05, **P < 0.01, ***P < 0.001. (D) Presents the associated term names on the left and a comparison to selected published datasets on the right (only mounts relevant to HS are shown). Note the short graphical overview in the right upper corner of each diagram. The complete dataset (gene numbers and RFs for all 44 gene expression mountains of all six HS conditions as well as RFs for previously published datasets) can be found in Table S7 in Supplementary Material. 1Shaw et al. (2007), 2Evans et al. (2008), 3Fisher and Lithgow (2006), 4Troemel et al. (2006), 5Viswanathan et al. (2005), 6Pietsch et al. (2012).

