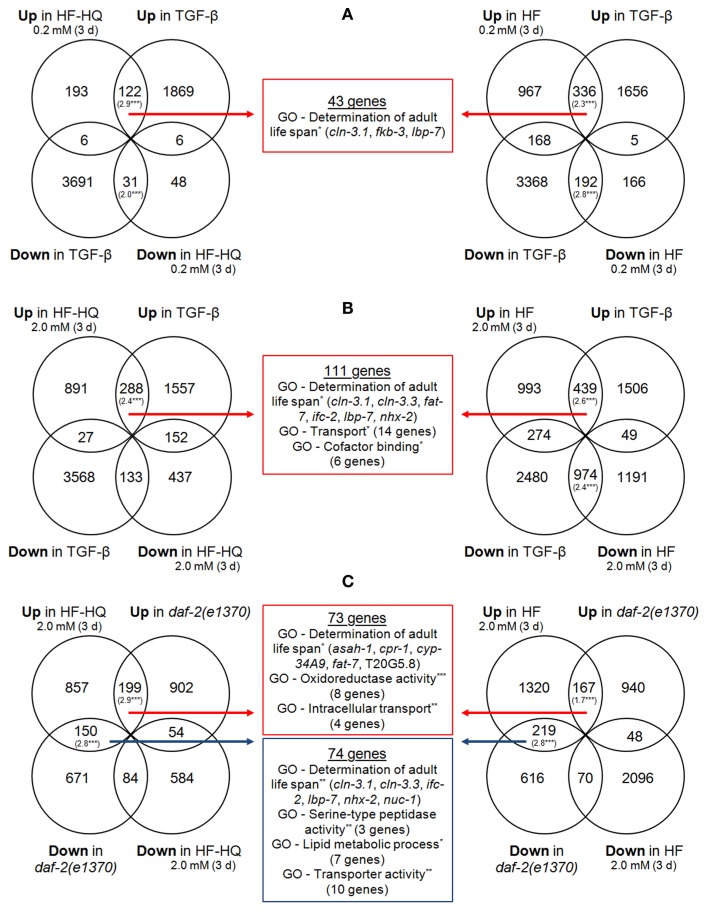
Figure 3.
Overlap of similarly regulated genes. Shown are comparisons of DNA microarray data sets of HF (right) and HF-HQ (left) treatments with the data set derived from TGF-β adults (Shaw et al., 2007) – 0.2 mM DOC HS (A) and 2.0 mM DOC HS (B) – as well as from daf-2(e1370) mutants (Evans et al., 2008) (C). The RF values in brackets indicate a significant overlap between the data sets. The middle section represents the overlap of DEGs in both HF, HF-HQ, and the comparative condition, shown are significantly over-represented GO terms (Biological process), the associated number of genes, and the individual names of all genes which are part of the GO term “Determination of adult life span.” Red arrows/boxes are intersections of commonly up-regulated transcripts; blue arrows/boxes are intersections derived from genes with opposite transcriptional responses. *P < 0.05. **P < 0.005. ***P < 0.001

