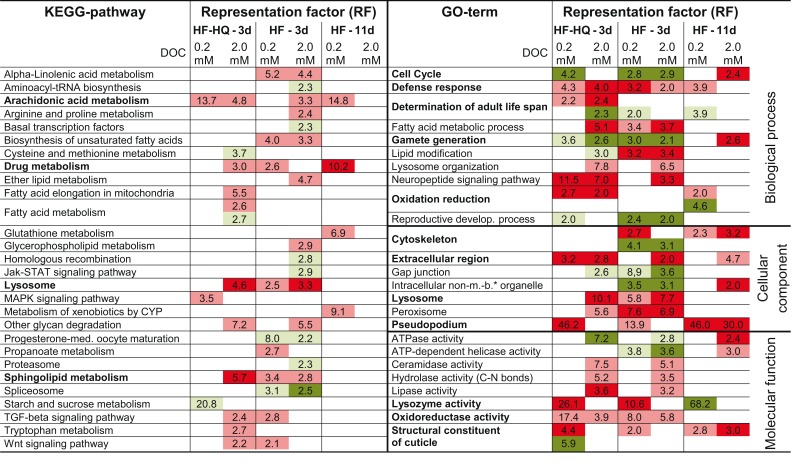
Table 2.
Overview of over-represented KEGG pathways and gene ontology terms in DEG lists.
 |
Shown is the representation factor for DEGs in the respective list in relation to the overall count in significantly enriched KEGG and GO terms, respectively; red label stands for up-, green for down-regulated genes; respective pale coloring corresponds to P < 0.05, deep colors to P < 0.001; apparently most relevant terms are given in bolt; please find more details in Tables S3 and S4 in Supplementary Material. *Membrane-bound.
