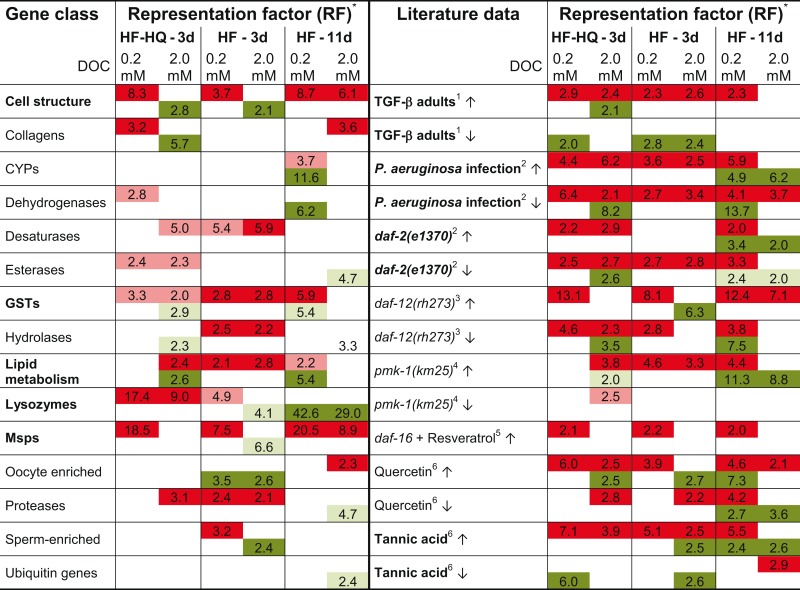
Table 3.
Overview of over-represented gene classes in DEG lists and comparison to literature data.
 |
*Shown is the representation factor for DEGs in the respective list in relation to the overall count in significantly enriched gene classes or in comparison to literature data; red label and ↑ refer to up-, green label and ↓ to down-regulated genes; respective pale coloring corresponds to P < 0.05, deep colors to P < 0.001; gene glasses and datasets deemed to be most relevant are given in bold; for more details see Tables S5 and S6 in Supplementary Material. 1Shaw et al. (2007), 2Evans et al. (2008), 3Fisher and Lithgow (2006), 4Troemel et al. (2006), 5Viswanathan et al. (2005), 6Pietsch et al. (2012).
