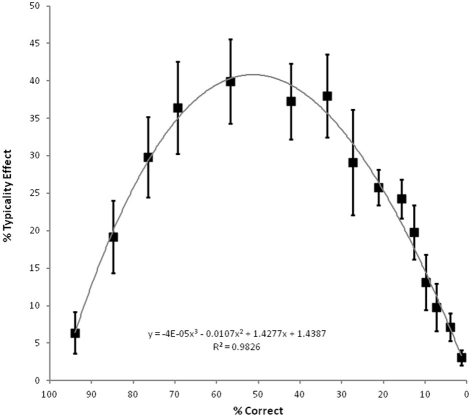
Figure 2.
Average magnitude of the concept typicality effect in picture naming accuracy (high typicality minus low typicality) for the 15 severity groups of 15 observations each, according to average overall level of accuracy, with cubic regression line and associated equation and fit. Error bars represent ±90% confidence intervals, hence those points in which they do not encompass the origin correspond to significant effects at an alpha level of 0.05 using a paired one-tailed t-test. Adapted from Figure 2 of Woollams et al., (2008, p.2507).

