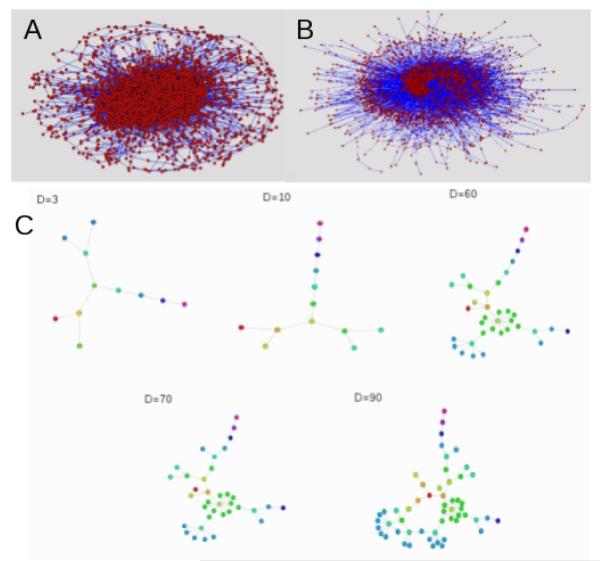
Figure 2.
Plots of a model network and reachable subgraphs. A: The largest component of a contact network over five years. B: A large reachable subgraph initiated from a node with degree five, with duration of infectiousness 100 weeks. Of the subgraphs calculated, 48% contained at least 2000 nodes and 47% contained no more than 20 nodes, leaving only 5% in the range 20 - 2000. C: A small reachable subgraph showing the increase in size with increasing duration of infectiousness. Infection starts at the red node; nodes of the same colour are at the same number of links from the starting point. Plots were created using Pajek [5]. The degree of the originating node is 3.

