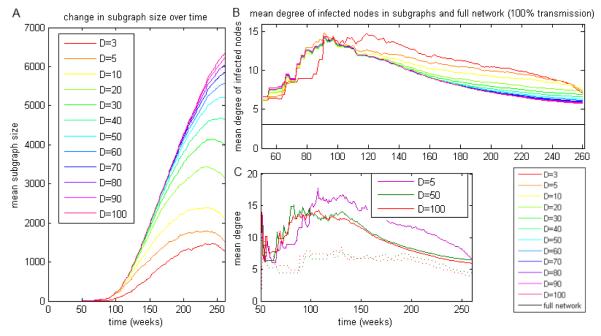
Figure 3.
Degrees of nodes included in reachable subgraphs. The aggregated, rather than instantaneous, degrees are shown, so that the mean activities reported relate to overall activity level and not to the number of contacts in each particular week. Duration of infectiousness (D) values are given in weeks. A: Size of the network reachable to the pathogen over time, by duration of infectiousness. B: Mean activity of potentially infected nodes over time, for subgraphs with the same start position and start time. The mean activity in the network as a whole (black horizontal line) is much lower than the mean activity in any of the D-graphs. C: Mean activity of potentially infected nodes over time, for pathogens with 10% (dotted lines) and 50% (solid lines) transmission probability, at durations of 5, 50 and 100 weeks. The 10% transmission probability with short duration went extinct after a short time. The rise in mean activity soon after the pathogen is introduced corresponds to a rise in the subgraph’s size when the part of the entire network containing high-activity individuals is reached.

