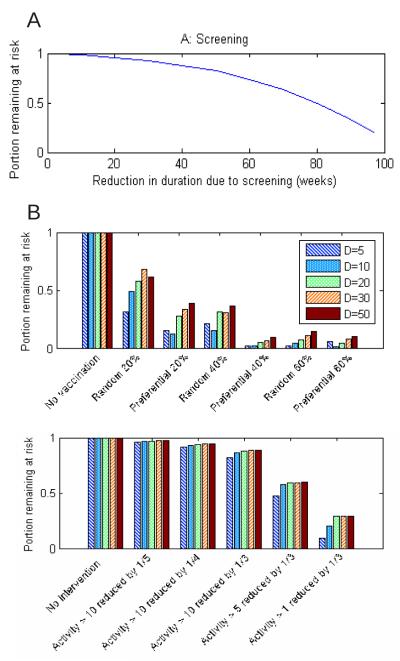
Figure 5.
Effects of interventions, showing that a pathogen’s duration of infectiousness (and hence extent of concentration in high-risk groups) has little effect. A: Screening. An intervention modelling reducing the duration of infectiousness (from 100 weeks) by the amounts shown can reduce the size of the at-risk group (reachable subgraph). B: Vaccination. In some cases the subgraph collapsed due to disconnectedness, representing vaccination of an individual near the seed case (not plotted). This occurred in 6-9, 1-6, 0-7, 2 and 1 cases for durations D=5, 10, 20, 30 and 50 respectively. C: Behavioural intervention. Again, epidemic size was reduced to near 0 due to disconnectedness in approximately 1/5 of cases.

