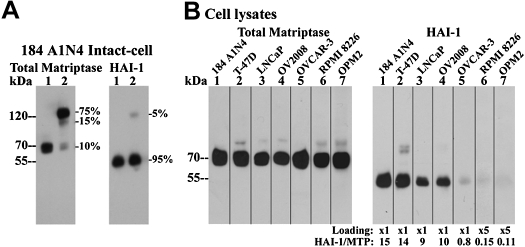
Fig. 1.
Ratios of hepatocyte growth factor activator inhibitor-1 (HAI-1) and matriptase protein levels relative to each other vary significantly among different cells. A: ratio of HAI-1 to matriptase in 184 A1N4 mammary epithelial cells. Cells were exposed to pH 6.0 buffer in the presence (lanes 1) or in the absence of 0.15 M sodium chloride at room temperature for 20 min to induce matriptase activation (lanes 2). Cells were lysed and analyzed by immunoblot for total matriptase using the mAb M24 and for HAI-1 using the mAb M19, as indicated. Ratios of individual matriptase species relative to total matriptase were determined from their protein band densities using a densitometer. Ratios of individual HAI-1 species relative to total HAI-1 were also determined, as indicated. B: ratios of HAI-1 relative to matriptase in a panel of matriptase-expressing cells. Matriptase levels were analyzed by immunoblot using matriptase mAb M24 among 7 different cells, and the loaded cell lysates were adjusted to yield similar levels of matriptase (total matriptase, lanes 1–7). HAI-1 levels of these 7 cells were further determined by immunoblot using HAI-1 mAb M19 against the normalized matriptase levels for 184 A1N4 (lanes 1), T-47D (lanes 2), LNCaP (lanes 3), OV2008 (lanes 4), and OVCAR-3 (lanes 5) and 5-fold matriptase levels for RPMI-8226 (lanes 6) and OPM2 (lanes 7) due to their extremely low levels of HAI-1. Band densities of matriptase and HAI-1 were determined by densitometer. Ratios of HAI-1 relative to matriptase for individual cells were determined by comparing to those of 184 A1N4 cells.

