Fig. 5.
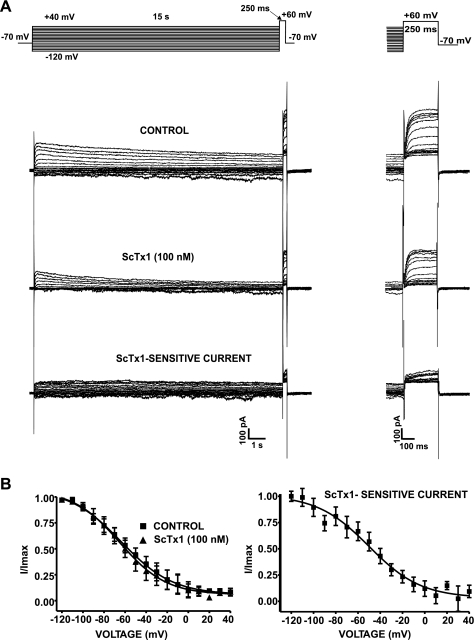
Voltage-dependent inactivation of ScTx1-sensitive KV currents in guinea pig DSM cells. A: representative recording of the effect of ScTx1 on the whole cell KV current elicited by a 15-s long-lasting double-pulse voltage-step protocol (top). The scale bar applies to all recordings. The expanded scale at right shows the currents during the 250-ms test pulse to +60 mV. B: steady-state KV current inactivation curves show voltage dependence of inactivation in the absence (control) or presence of 100 nM ScTx1 (n = 7; N = 5). The inactivation curves were obtained by plotting the normalized peak currents (I/Imax) recorded during the 250-ms test pulse to +60 mV as a function of the voltage of the 15-s prepulse. Data were fitted using a single-component Boltzmann equation. The steady-state inactivation curve of the subtracted ScTx1-sensitive current is also shown. Values are means ± SE. All experiments were performed in the presence of the selective BK channel inhibitor paxilline (100 nM).

