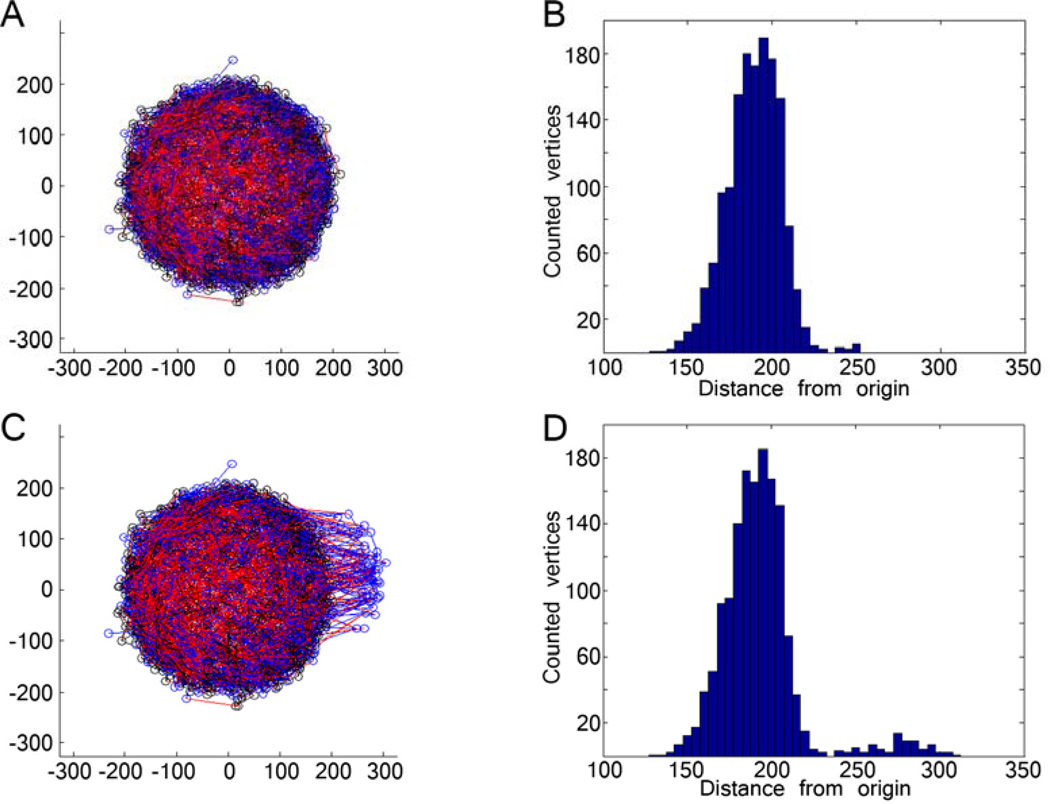
Figure 1. Creating a bleb on a simulated lamina network.
(A) A pre-equilibrated lamin network of 3000 A-type lamins (red) and 3000 B-type lamins (blue) interconnected with 1500 ‘connector’ molecules (black). (B) The histogram of vertices (represented as circles in A) represents the lamin distribution in the pre-equilibrated nucleus, and shows a normal distribution with some fluctuation. (C) Bleb induced by translocation of lamins by 50% of the nuclear radius. (D) The distribution of vertices shows a second mode distribution of vertices.

