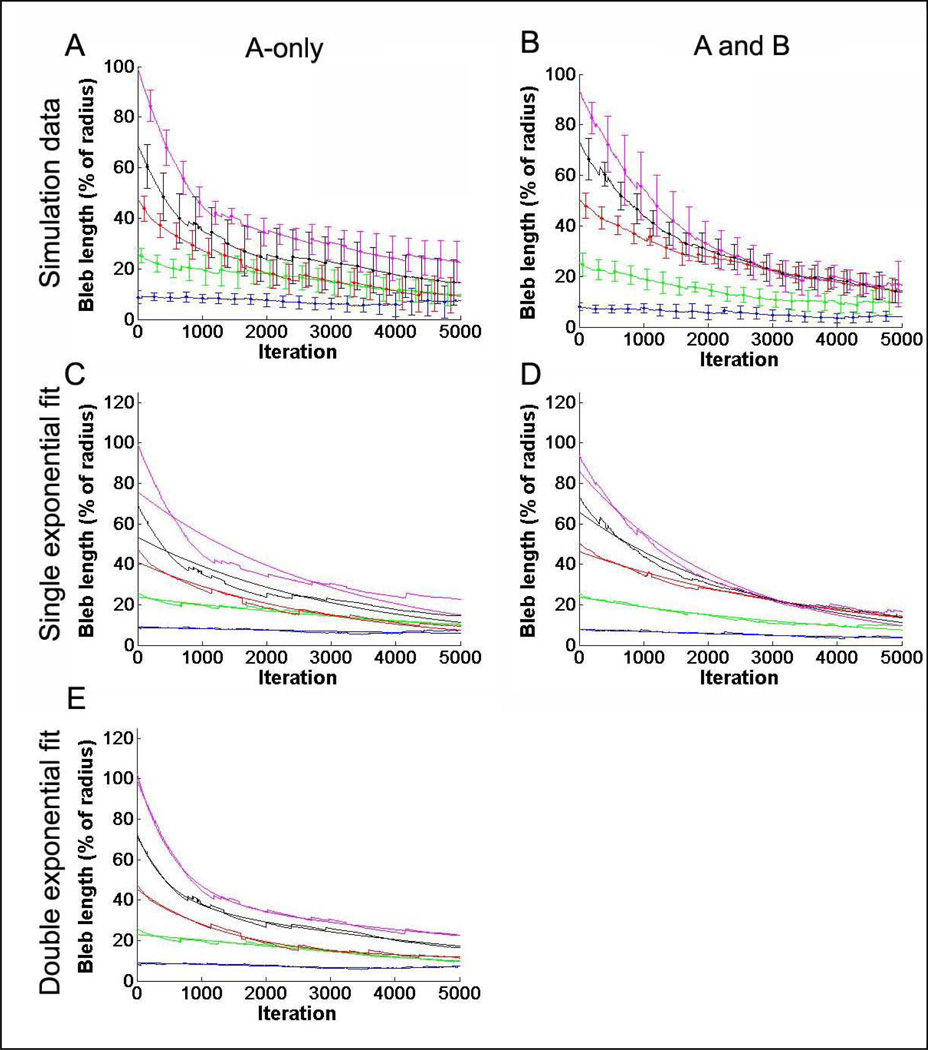
Figure 2. Tracking bleb dynamics over time shows different relaxation profiles based on networks involved.
(A) The mean of eight trials each for blebs of increasing initial size (y-axis) in systems where only the A-type lamin network was perturbed. Bleb sizes selected were 10%, 25%, 50%, 75% and 100% of the equilibrium nucleus radius. Larger blebs appeared to retract faster than smaller blebs at early times (iterations). Error bars represent standard deviation and are presented every 250 iterations for clarity. (B) Similar trials for blebs containing both A and B lamin networks show more gradual initial retraction. (C) Fits of a single exponential decay to data from blebs of A-type lamin networks show deviation for large blebs suggesting bimodal reorganization. (D) Fits of a single exponential decay to blebs containing both A- and B-networks shows strong correlation. (E) Double exponential fits to A-only data appear to capture the features better.

