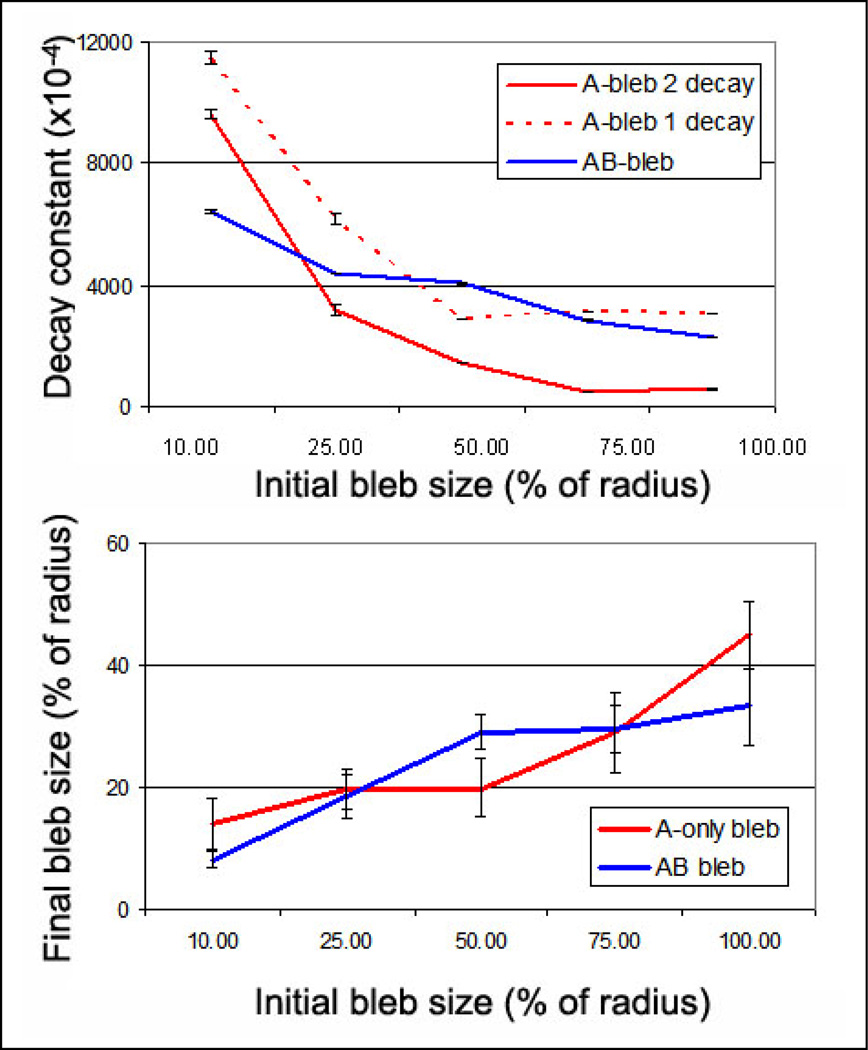
Figure 3. Quantification of bleb retraction based on initial bleb size shows different behavior for 1-component blebs versus 2-components.
(A) The decay constant, which is a single exponential fit of the retraction versus iteration from Figure 2, is plotted versus the initial bleb size and shows differential behavior in A-only and AB-lamin networks. AB network blebs show a relatively linear increase in decay constant with increasing bleb size (raw data as a solid line and approximate fit as a dashed line), suggesting that larger blebs retract faster. In contrast the A-only network bleb appeared to show fast retraction at small bleb size, and constant retraction at larger bleb size. We have plotted both the single-exponential fit and the double exponential fit (A-bleb 1 decay and A-bleb 2 decay, respectively) to show that the fitting does not affect the qualitative trend. (B) The decay constants are reflected in the final, equilibrium sizes of the blebs, wherein the “slow and steady” recession of the AB blebs produce smaller blebs at large initial blebs.

