
Figure 3.
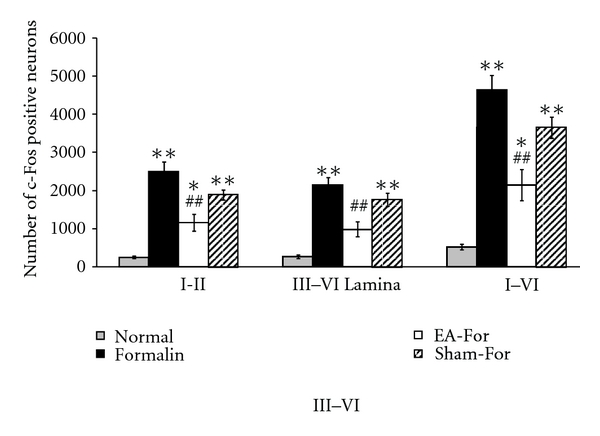
The number of c-Fos positive neurons in different groups. C-Fos positive cells were counted by MetaMorph software in lamina I-II and lamina III–VI at the L5 segment of the spinal cord ipsilateral to the site of formalin injection. Experimental groups were classified as follows: Normal: no treatment group; Formalin: formalin injection only group; EA-For, electroacupuncture treatment at BL60 before formalin injection; Sham-For, acupuncture needle insertion at BL60 but no electric stimulation before formalin injection. In each region, there was a significant decrease of c-Fos positive neurons when electroacupuncture was treated at BL60 compared to the Formalin group. On the other hand, in a comparison between Normal group and the other groups, there were notable increases in c-Fos positive neurons in the EA-For group and Sham-For group. Each bar represents the group mean ± SEM (*P < 0.05, **P < 0.01 for comparison between Normal group and all the other groups, one-way ANOVA followed by Dunnett's post hoc multiple comparison: ## P < 0.01 for comparison between Formalin group and EA-For or Sham-For group, one-way ANOVA followed by Dunnett's post hoc multiple comparison).