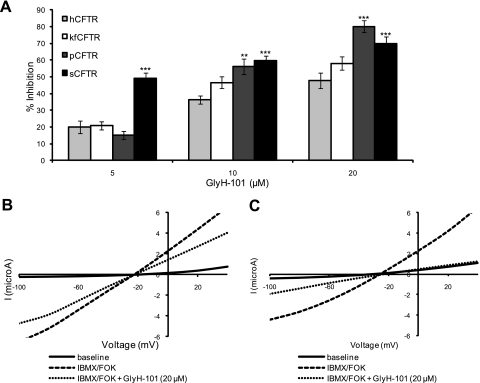
Fig. 7.
Comparison of the effects of GlyH-101 on different CFTR orthologs. A: summary of mean % inhibition of hCFTR (n = 5), kfCFTR (n = 7), pCFTR (n = 4), and sCFTR (n = 5) with 5, 10, and 20 μM of GlyH-101. All orthologs are responsive to GlyH-101. All values are means ± SE. *P < 0.05; **P < 0.01; ***P < 0.001 compared with hCFTR. B and C: representative I-V plots from oocytes expressing h- (B) and sCFTR (C).

