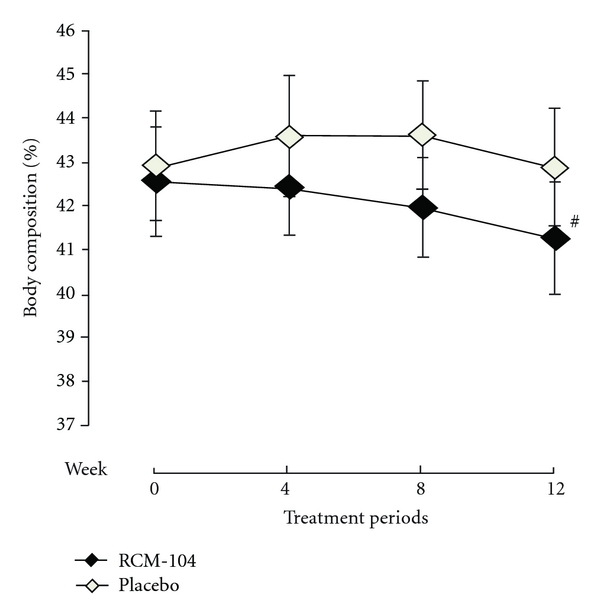
Figure 4.

Change in body fat composition (%) after 12-week treatment. The plotted line graphs indicate the means ± SD of change of body fat composition at each assessment visit, RCM-104 group (◆) and placebo control group (◊). (#) indicates value not significantly different using ANCOVA and ITT, (P > 0.05).
