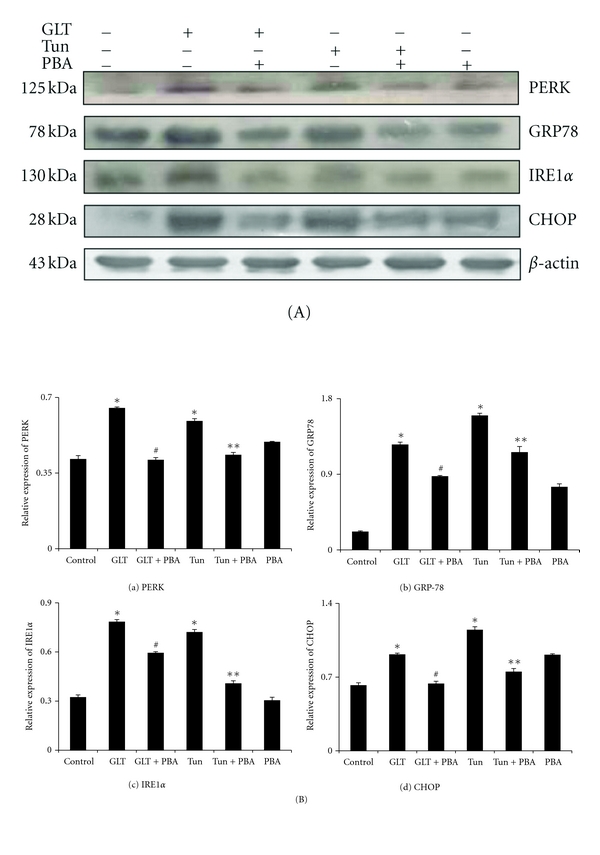
Figure 3.

(A) Representative protein expression data on ER stress protein markers, namely, PERK (1), GRP78 (2), IRE1α (3), and CHOP (4). (B) Cumulative histogram data Mean (±SEM) of ER stress markers, namely, PERK (a), GRP78 (b), IRE1α (c) and CHOP (d). *P < 0.05 compared to control, # P < 0.05 compared to GLT, **P < 0.05 compared to tunicamycin.
