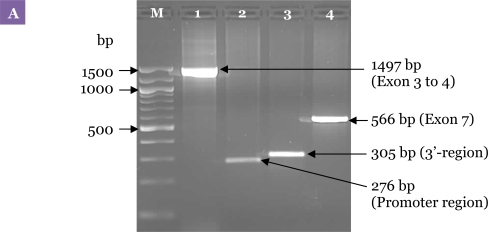
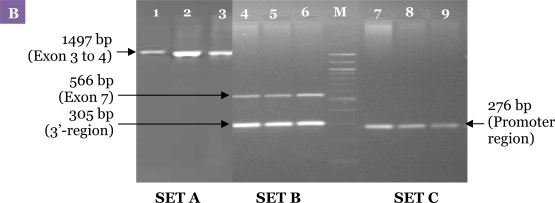
Figure 3:
Electrophoresis pattern for the first PCR carried out with the specific primers. (A) Uniplex amplification of the 4 regions of DRD2. Lane 1: exon 3 to 4 with primer sets DRD2EX3&4FW and DRD2EX3&4RV; Lane 2: the promoter region (i.e., 5′-untranslated region) with D2PRFW and D2PRRV; Lane 3: the 3′-untranslated region (i.e., TaqI A) with D2TAQ1AFW and D2TAQ1ARV; Lane 4: exon 7 with DRD2EX7FW and DRD2EX7RV. (B) Result of the first PCR of 3 DNA samples that were obtained using the optimised PCR method. Lanes 1–3: PCR amplification of Set A, exon 3 to 4; Lanes 4–6: Set B, exon 7 and the 3′-untranslated region simultaneously; Lanes 7–9: Set C, the promoter region. M: 100-bp DNA ladder.


