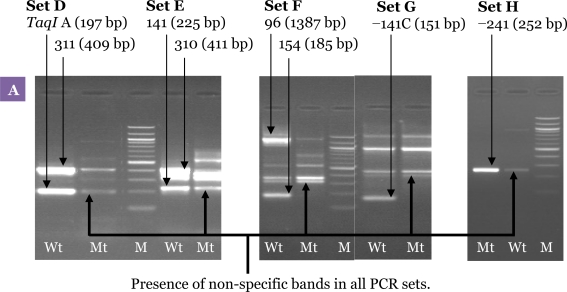
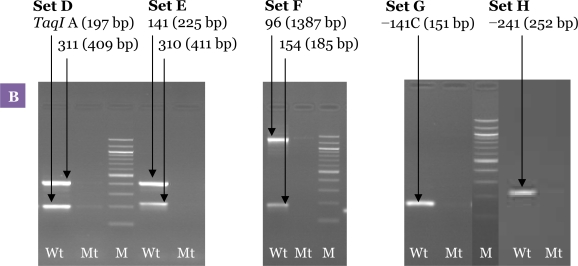
Figure 5:
Optimisation of the allele-specific multiplex PCR. Agarose gel electrophoresis of the products from the second PCR showing the effect of different MgCl2 and Taq polymerase concentrations. (A) Results of the second PCR products amplified at concentration of MgCl2 2.0 mM and Taq polymerase 1.0 U showing the presence of non-specific bands in all PCR sets. (B) Second PCR products amplified at a concentration of MgCl2 1.0 mM and Taq polymerase 0.5 U. Results showed that MgCl2 and Taq polymerase concentrations have a significant effect on elimination of the non-specific bands, and all the expected bands were visualised clearly. M: 100-bp DNA ladder; Wt: wild-type; Mt: mutant-type.


