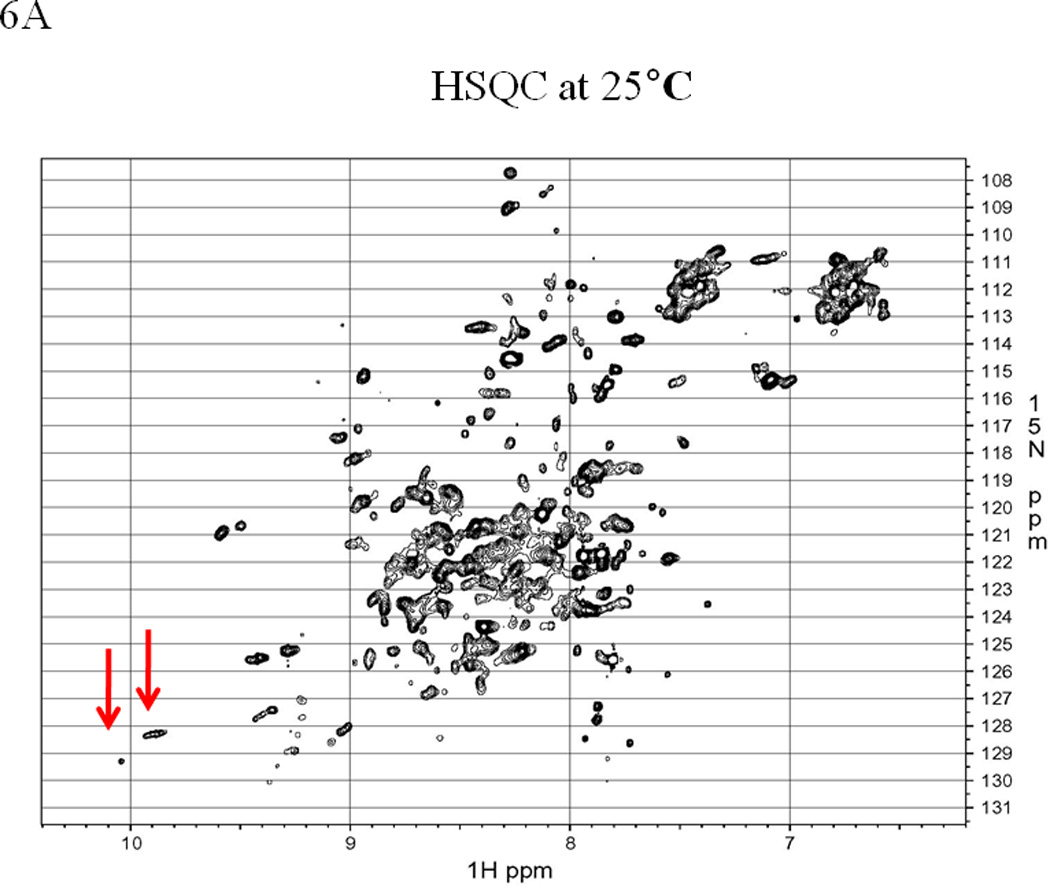
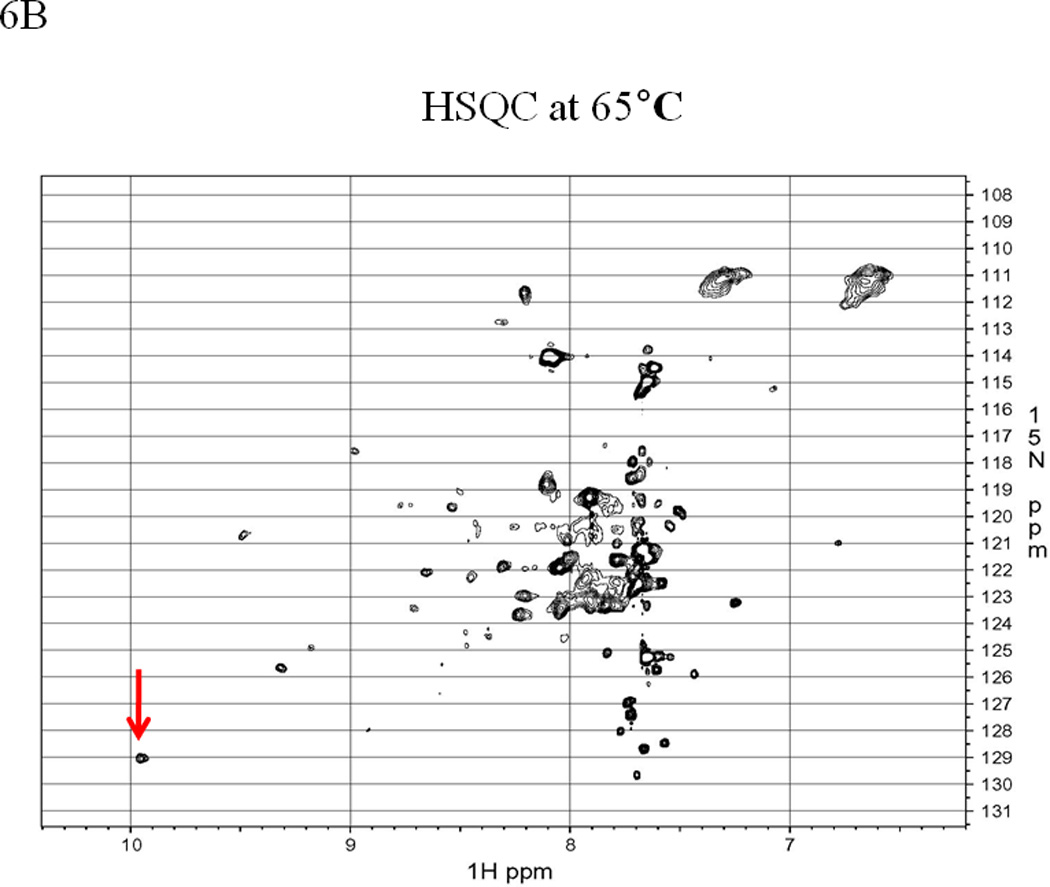
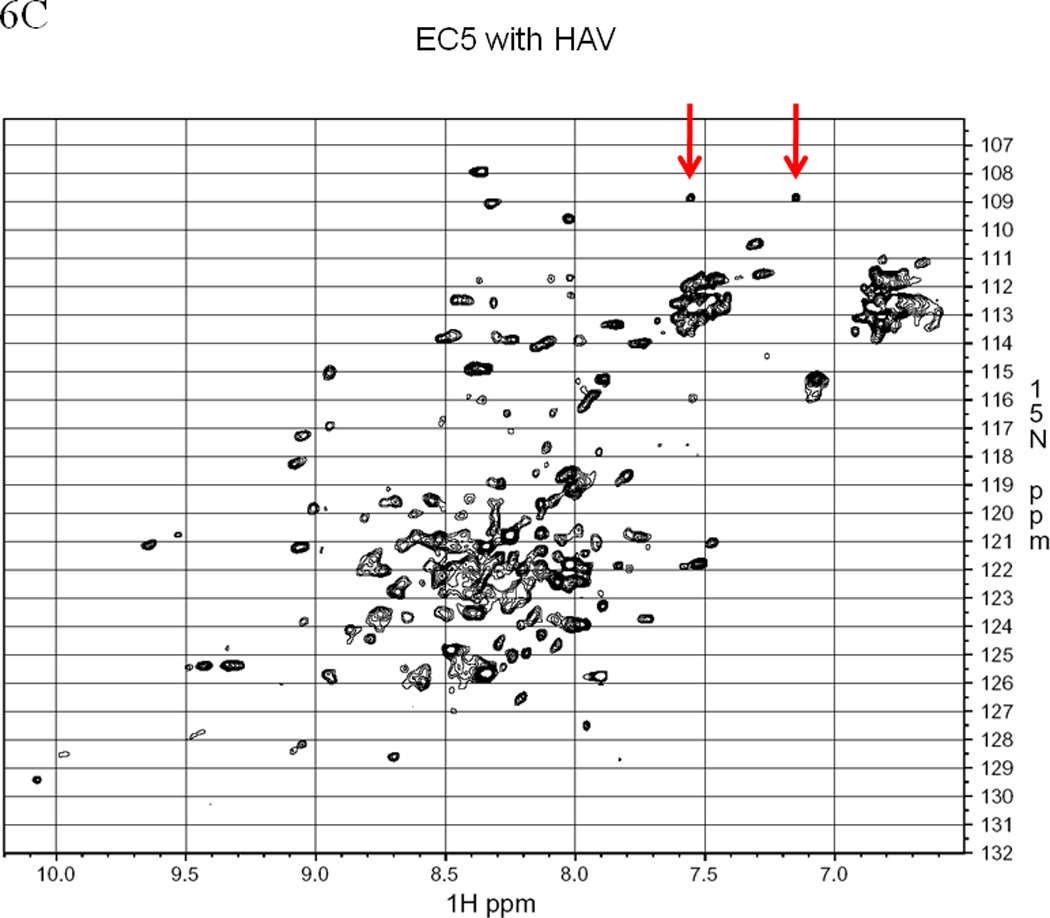
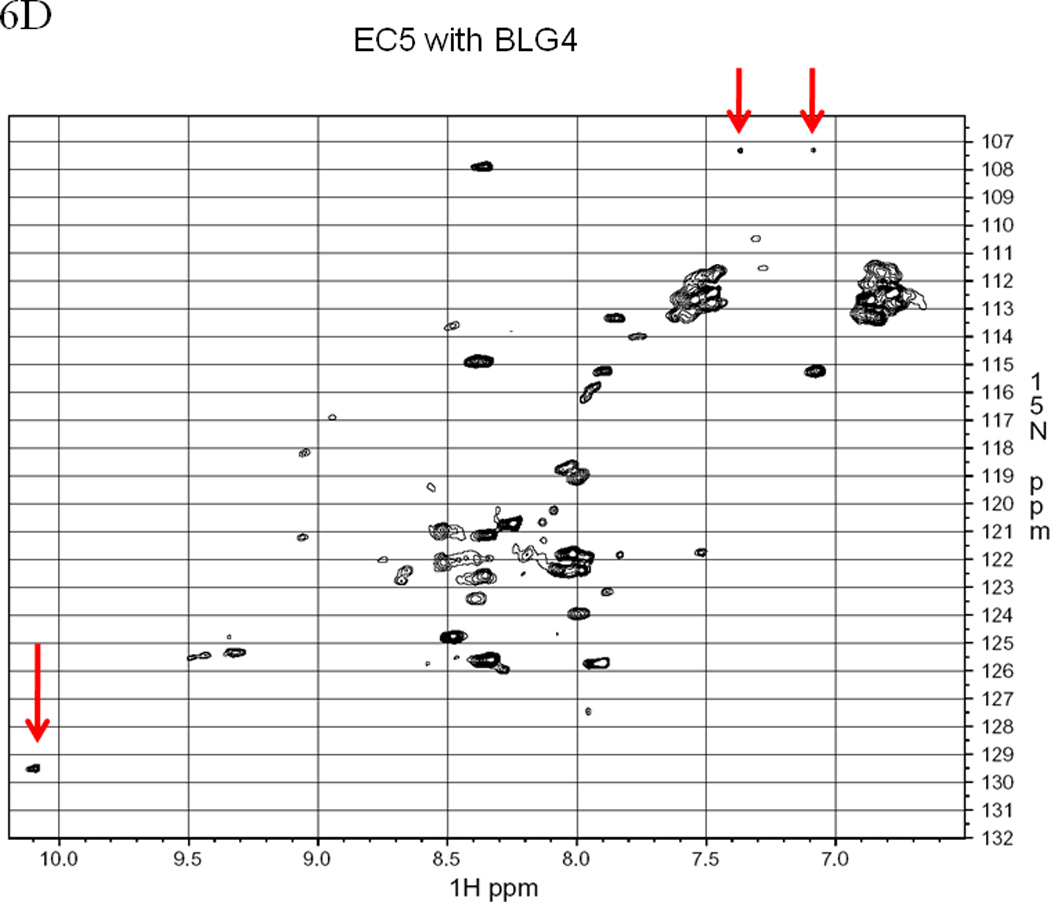
Figure 6.


EC5 tertiary structure monitored by NMR with arrows indicating the resonance(s) for the indole NH of the Trp residue. The 1H-15N HSQC NMR spectrum of 0.5 mM EC5 domain in 25 mM Tris buffer with 10% D2O in pH 7.5 at (A) 30 °C and (B) 65 °C. 1H-15N-HSQC NMR spectrum of 0.2 mM 15N labeled EC5 in 100 mM Tris buffer containing 5% D2O at pH 7.5 and room temperature. (C) EC5 in the presence of 20 mM HAV peptide. The red arrows indicate the chemical shift changes seen after peptide binding. (D) The NMR spectrum of EC5 upon addition of 10 mM BLG4 peptide and the chemical shift changes upon peptide addition are indicated by red arrows.
