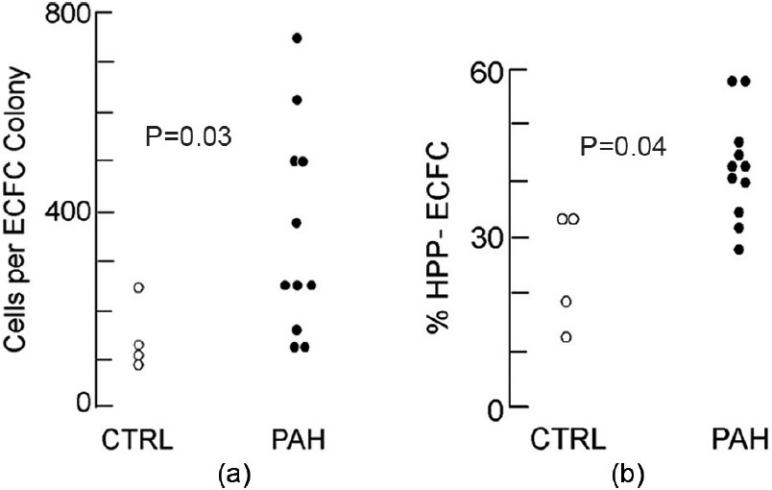
Figure 4.

PAH PAEC gave rise to ECFC that generate larger colonies and a higher proportion of HPP ECFC: (a) Median number of cells per ECFC colony from control and PAH PAEC. Vertical axis represents cells per ECFC colony. Each circle represents the median number of cells per ECFC colony from an individual patient. Open circles represent control and filled circles represent PAH. (b) ECFC were subcultured into 24-well plates to assess for HPP ECFC based on ability to form colonies. Vertical axis is percentage of HPP ECFC as a fraction of total ECFC.
