Figure 1.

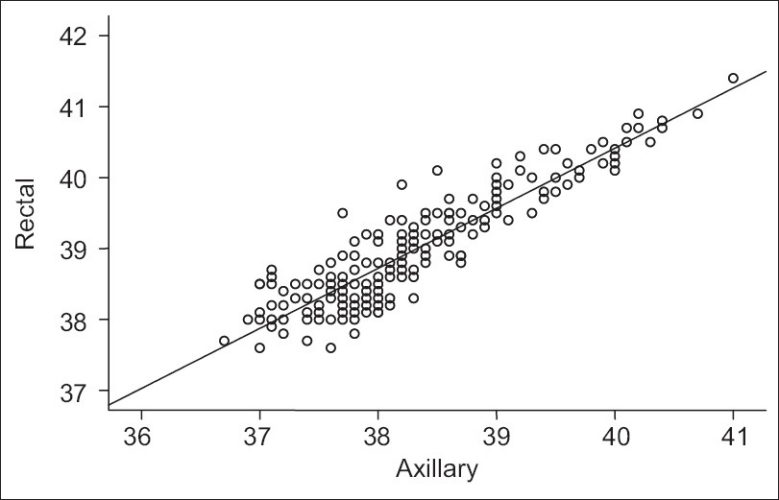
Scatter diagram showing the relationship between rectal and axillary temperatures (°C) in the 400 febrile children (r=0.91)

Scatter diagram showing the relationship between rectal and axillary temperatures (°C) in the 400 febrile children (r=0.91)