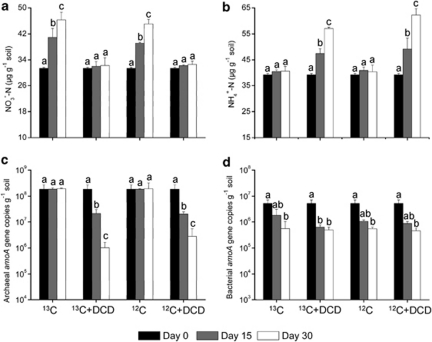
Figure 5.
Changes in concentrations of (a) nitrate, (b) ammonium, (c) abundance of thaumarchaeal amoA genes and (d) abundance of bacterial amoA genes during DNA-SIP microcosms of HZ soil for 15 or 30 days. Error bars represent standard errors of triplicate samples. Different letters above the bars indicate a significant difference (P<0.05).

