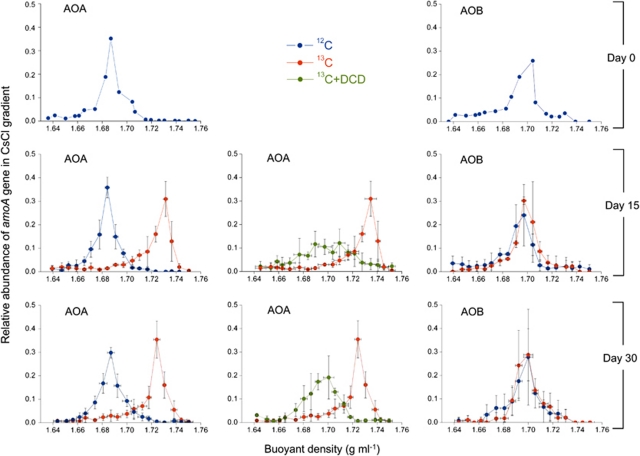
Figure 6.
Distribution of the relative abundance of thaumarchaeal and bacterial amoA gene in CsCl gradient for 13C-CO2, 12C-CO2 and 13C-CO2 + DCD treatments during DNA-SIP microcosms of HZ soil. Twenty fractions of genomic DNA extracted from each 4.9-ml centrifuge tube covered a buoyant density from 1.64 to 1.75 g ml−1. The plotted values are the proportion of thaumarchaeal or bacterial amoA gene copy numbers in each fraction to the total abundance across the gradient. Vertical error bars represent standard errors of the relative abundance from triplicate samples. Horizontal error bars represent standard errors of buoyant density of the same order fraction from triplicate samples.

