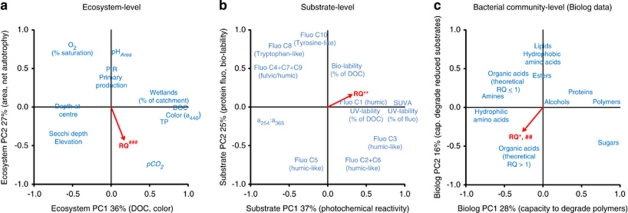
Figure 4.
PC loading plots, showing major axes (PCs) of variation in (a) ecosystem properties, (b) substrate quality and (c) bacterial community capacity to degrade different compounds on the Biolog Ecoplate. Percent explained variance by each PC is indicated in the axis title. Vectors show Pearson correlations between RQ and PC scores. Variables in italics have been log-transformed to improve normality. Asterisks and squares denote significant correlations with horizontal and vertical axis, respectively (single symbol P<0.05; double symbol P<0.01; triple symbol P<0.001).

