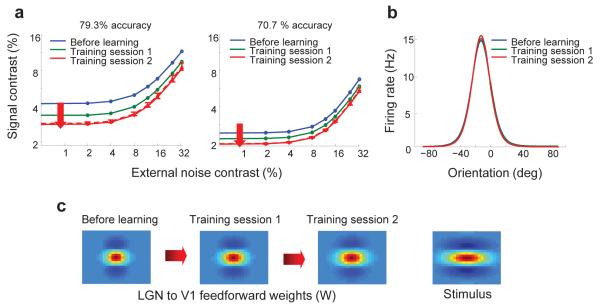
Figure 3.
Modeling perceptual learning using a realistic neural model of orientation discrimination. (a) Replicating the uniform shifts in TVC curves (Fig. 1b,c) using the neural model of orientation discrimination. These results were obtained by adjusting the feedforward connections between the LGN and V1 in a manner that moved them towards a matched filter for the stimulus. After training, we reran 10 new simulations with ±10% independent noise added to the final (training session 2) feedforward thalamo-cortical weights. The red dashed TVC curve represents the average TVC curve across the 10 runs and the error bars represent one standard deviation around the average values. It is clear that although there is variability in the TVC curve, for both performance criteria the qualitative results are robust to perturbations in the post-learning weights. (b) Tuning curves of cortical neurons from the network, demonstrating modest amplification and sharpening as a result of learning. The x-axis represents orientation (in degrees) and the y-axis represents firing rate (in Hz). (c) Moving the thalamo-cortical feedforward weights towards a matched filter. The rightmost panel shows the 2-D spatial profile of a stimulus. The leftmost panel shows the 2-D spatial profile of the feedforward weights before learning, the second panel from left shows the spatial profile of the feedforward weights after one training session and the panel second from the right shows the spatial profile of the feed-forward weights after two training sessions. Together these figures show the spatial profile of the thalamo-cortical feedforward connections moving towards the spatial profile of the stimulus, a manipulation which led to the changes in TVC curves shown in a.

