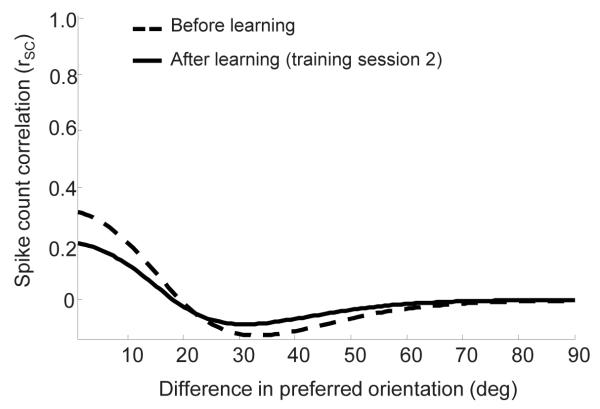
Figure 5.
The impact of perceptual learning on correlations. The dashed curve shows the correlation coefficients as a function of the difference in preferred orientation before learning. The correlation coefficients were computed using a similar procedure to that used in 38, in response to a stimulus with 8% signal contrast. As has been reported in vivo, correlations are between 0.4 and −0.1, and their magnitude decreases as a function of orientation difference. The solid curve shows the correlations after learning took place. The main effect of perceptual learning is to reduce the magnitude of the correlations while preserving the overall pattern of correlations.

