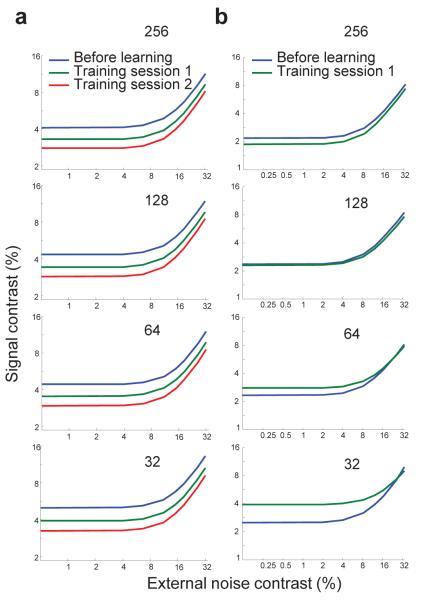
Figure 7.
TVC curves obtained from subsets of neurons in the networks shown in Figure 3 (a) and Figure 4b,f,j (b). The plots in each panel were obtained by simulating the full network, but by computing the TVC curve based on the response of a randomly picked sample of neurons. The number of neurons in each subset is indicated on each panel and varies from 256 to 32. (a) TVC curves obtained by subsampling the network shown in Fig. 3. The results are qualitatively the same, even when we sample as little as 32 neurons. (b) TVC curves obtained by subsampling the network shown in Fig. 4b,f,j. With 256 neurons, the results are similar to the results obtained with the full network (Fig. 4f) while with only 32 neurons, the result starts mimicking the results obtained with Ishuffled (Fig. 4j). The upward shift of the TVC curve with learning, observed with 32 cells, is therefore an artifact of subsampling and does not reflect the behavior of the whole neuronal population. All TVC curves were obtained for the 79% correct performance criterion.

