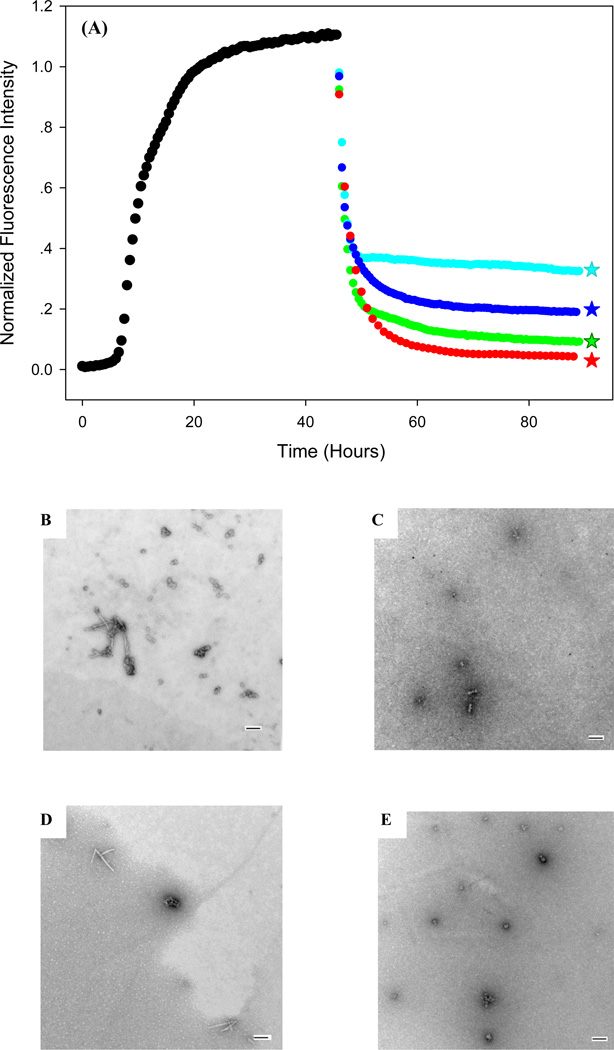
Figure 10.
Remodeling of IAPP amyloid fibers by amyloid inhibitors. (A) Thioflavin-T-monitored experiments are shown. Inhibitors were added at the time point indicated by the arrow. Black, IAPP alone; Red, EGCG; Green, GCG; Blue EGC; Cyan ECG. TEM images collected after addition of flavanols are also shown. The samples were removed at the time point corresponding to the stars. (B) IAPP plus EGCG. (C) IAPP plus GCG. (D) IAPP plus EGC. (E) IAPP plus ECG. Scale bars are 100 nm. Experiments were conducted at 25°C, pH 7.4, 20 mM Tris-HCl, 32 micromolar thioflavin-T, 0.25% DMSO, 32 micromolar IAPP, EGCG or its derivatives when present was at 32 micromolar.

