Figure 2.
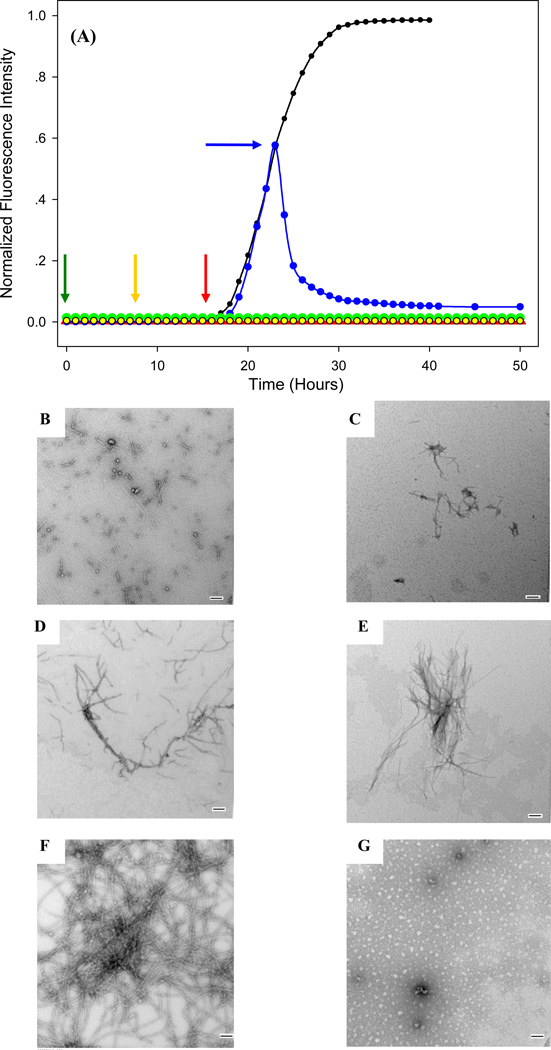
The effect of adding an equal amount of EGCG at various time points during amyloid formation by IAPP. (A) Thioflavin-T monitored kinetic experiments are shown: Black, IAPP alone, no EGCG; Green, EGCG was added at time=0, time point indicated by green arrow; Yellow, EGCG was added in the lag phase, at the point indicted by the yellow arrow; Red, EGCG was added at the end of the lag phase, at the time point indicated by red arrow; Blue, EGCG was added midway through the growth phase, at the blue arrow. TEM images of samples recorded before and after the addition of EGCG. Samples were removed immediately before EGCG was added and analyzed by TEM. The solution was then allowed to sit for an addition time and aliquots were removed after a total incubation time of 50 hours, measured from the initiation of amyloid formation. (B) Wild type IAPP in the middle of the lag phase before the addition of EGCG (yellow arrow). (C) Wild type IAPP an additional 43 hours after adding EGCG. (D) Wild type IAPP at the end of the lag phase before the addition of EGCG (red arrow). (E) Wild type IAPP an additional 33 hours after adding EGCG. (F) Wild type IAPP in the growth phase before the addition of EGCG (blue arrow). (G) Wild type IAPP an additional 27 hours after adding EGCG. Scale bars are 100 nm. Experiments were conducted at 25°C, pH 7.4, 20 mM Tris-HCl, 32 micromolar thioflavin-T, 16 micromolar IAPP, EGCG when present was at 16 micromolar.

