Figure 3.

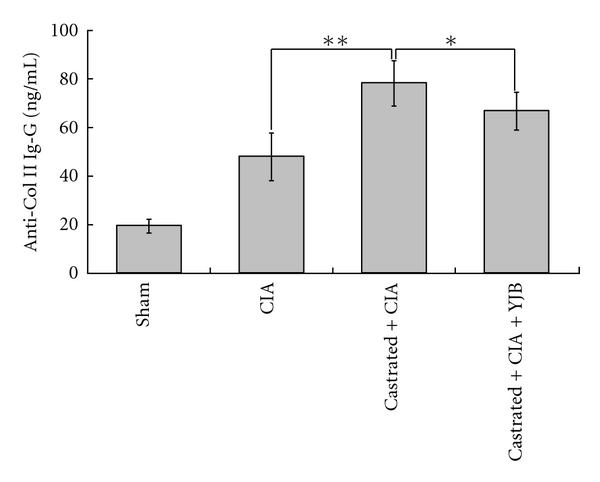
Changes of anti-Col II IgG in serum (n = 10). The level of anti-Col II was measured by ELISA. Data are expressed as means ± SD (**P < 0.01, *P < 0.05).

Changes of anti-Col II IgG in serum (n = 10). The level of anti-Col II was measured by ELISA. Data are expressed as means ± SD (**P < 0.01, *P < 0.05).