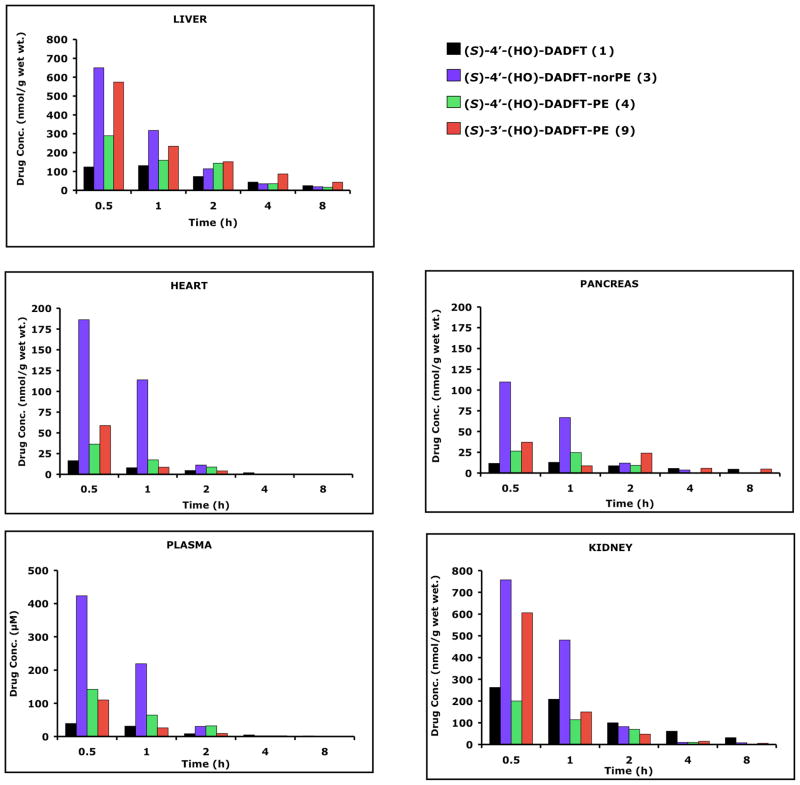
Figure 4.
Tissue distribution in liver, heart, plasma, pancreas, and kidney of rats treated with DADFT analogues 1, 3, 4, and 9 given p.o. at a dose of 300 μmol/kg. The concentrations (y-axis) are reported as nmol compound per g wet weight of tissue, or as μM (plasma). For all time points, n = 3. The data for ligands 1, 4, and 9 are from Bergeron et al. 2008.

