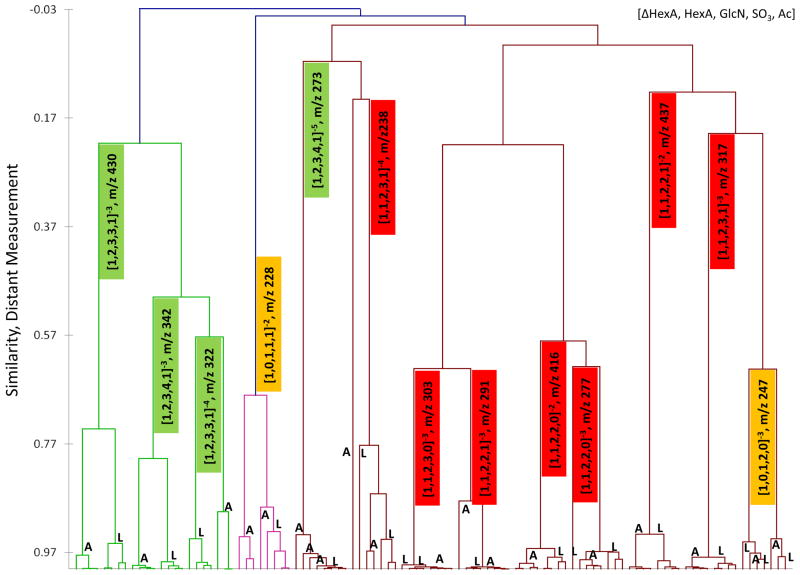
Figure 3.
Agglomerative hierarchal clustering of heparan sulfate tandem mass spectra from aorta (A) and lung (L). The dendrogram illustrates by clustering (X axis) and distance measurement (Y axis) the degree of similarity of the tandem mass spectra originated from different precursor ions and tissues. The colored boxes indicate the size of the HS oligomer: dp2, yellow; dp4, red; dp6, green.

