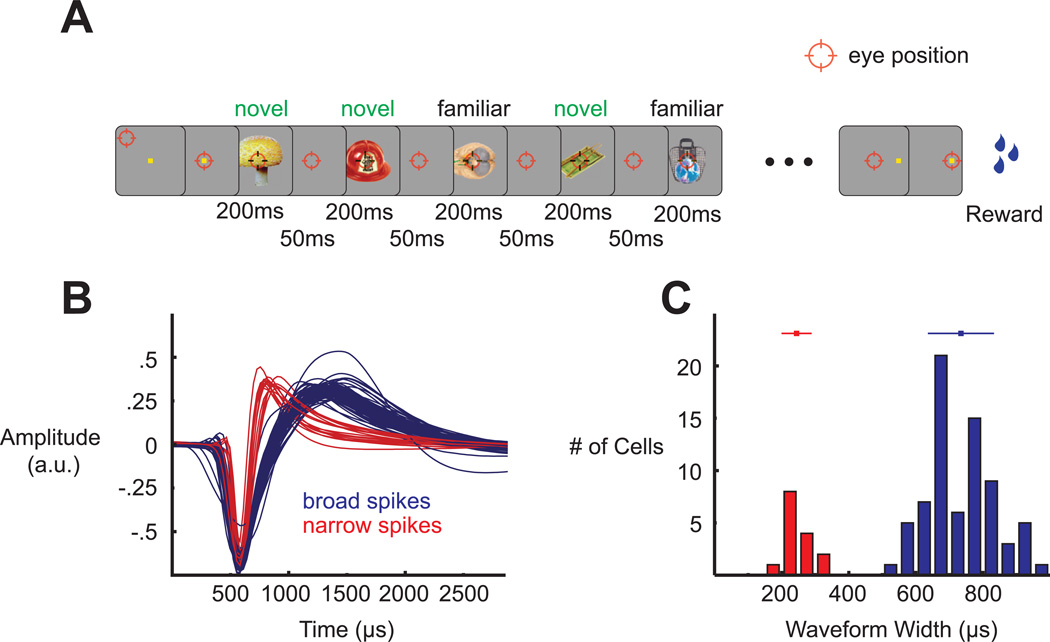
Figure 1.
Experimental paradigm and spike waveform clustering. (A) Passive fixation task during which 10 stimuli were presented for 200 ms each with a 50 ms interstimulus interval. Familiar and novel stimuli were interleaved. (B) All recorded spike waveforms, aligned by their troughs and labeled according to their cluster membership. (C) Distribution of spike widths (trough-to-peak durations) and the two clusters that emerged from the k-means algorithm. The bars above the distributions show mean ± SD of the respective distributions.

