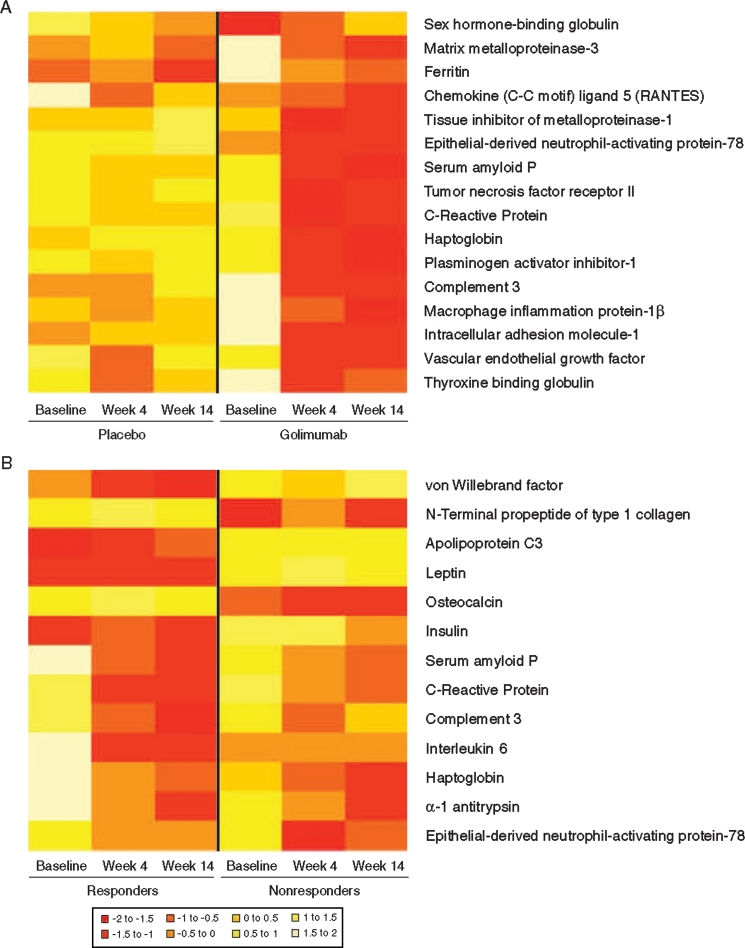
Figure 1.
Heatmaps representing biomarker levels at baseline, week 4 or week 14 in the placebo and golimumab groups (A) and for Assessment in Spondyloarthitis International Society response criteria (ASAS 20) responders and non-responders (B). Data were log2-transformed and then scaled to a mean of 0. Negative values (red) are thus below the mean and positive values (white) are above the mean (see figure key).

