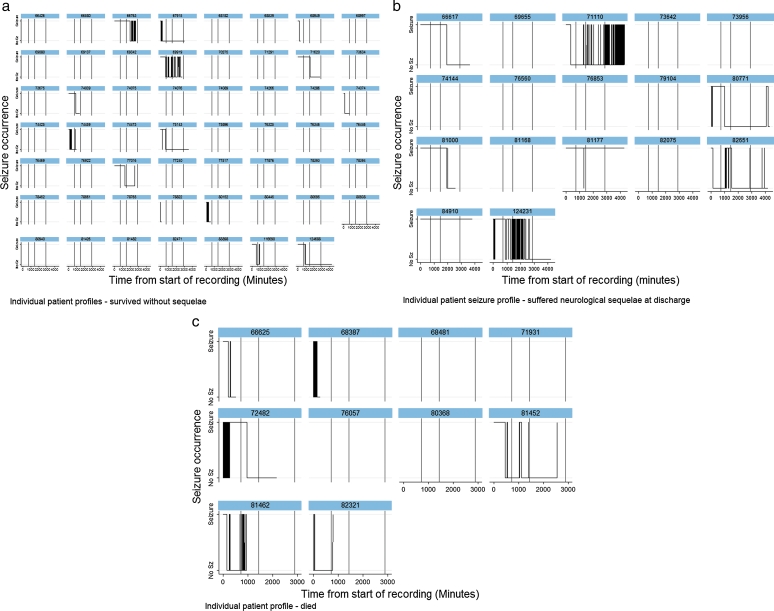
Figure 2.
Individual patient seizure profiles. (A) Seizure profiles of children who survived without any apparent neurological sequelae at discharge; (B) seizure profiles of children who had gross motor deficits at discharge from hospital; (C) seizure profiles of children who died during admission. The y axis allows for two values: a floor indicating no seizure and a ceiling indicating a seizure. All values within the individual traces take on one or other of these two values throughout time which is measured in minutes since admission on the x axis. Proportionately, more children who died or had motor deficits at discharge had more seizures, indicated by repeated vertical lines representing repeated seizures, and horizontal lines on top of the individual graphs, representing individual prolonged seizures. Sz, seizure.

