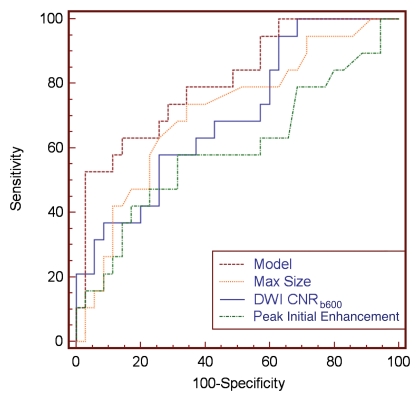
Figure 4:
Comparison of optimal multivariate model with individual univariate models with ROC curve analysis. Graph shows that a model incorporating both CNR for DW images with b of 600 sec/mm2 (CNRb600) and maximal (Max) lesion size provided the best discriminative ability (AUC = 0.81) than did individual parameters (AUC = 0.71 for maximum size, AUC = 0.70 for CNR).

