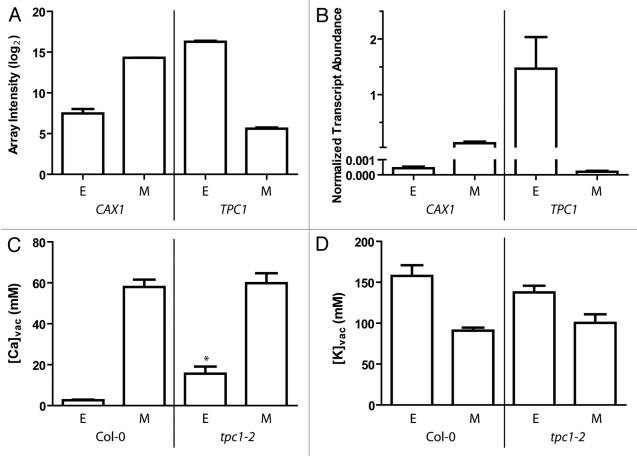
Figure 1.
(A) Expression of TPC1 and CAX1 in epidermal (E) and mesophyll (M) cells. Sampled using SiCSA and subsequent microarray (mean log2 array spot intensity + S.E.M.) or (B) qPCR (mean transcript abundance + S.E.M.) normalized against EF1-α and β-Tubulin5; n = 3 for each cell-type isolated from three different plants. For methods see Conn et al.4,5 Mean transcript abundance was statistically different between epidermal and mesophyll samples between genotypes for both genes (p < 0.05, using a One-way ANOVA and tukey’s posthoc test). (C) Vacuolar [Ca] in Col-0 and tpc2–1, n = 7 per cell type across 3 plants. Asterisk indicates a statistically significant larger value p < 0.01 in epidermal [Ca] of tpc1–2 compared with Col-0 using an unpaired t-test with Welch’s correction (GraphPad Prism). (D) Vacuolar [K] in Col-0 and tpc2–1, n = 7 per cell type across 3 plants. No statistically significant differences were detected between cell-types.

