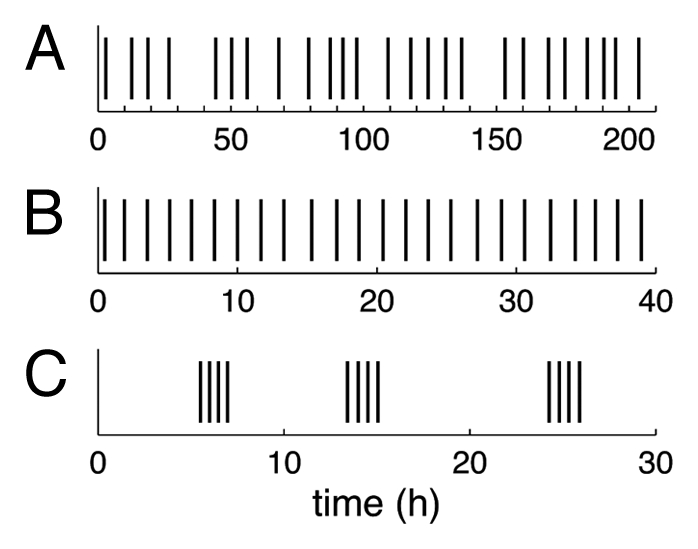
Figure 3.

Spontaneous firings recorded on different Utricularia traps. Vertical bars mark the times at which a spontaneous firings occur. Traps (A) and (B) show regular firings with more fluctuations for the first trap, the second having a very well defined firing frequency. Trap (C) fires by groups of four firings (“bursts”) separated by a variable amount of time. Data taken from reference 9.
