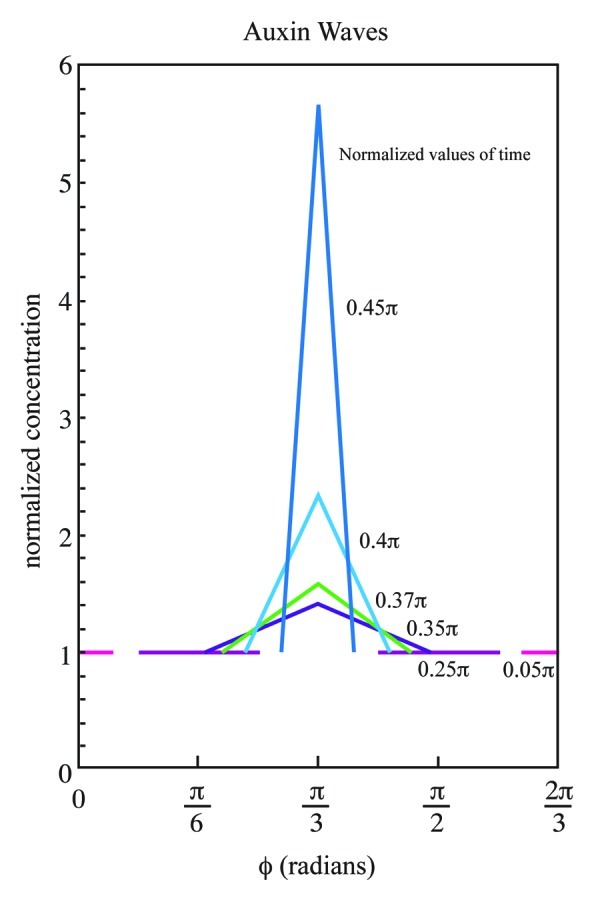
Figure 4.

Illustration of propagation. Using equations A3 and A4 of the Appendix, square waves in the L = 3 whorl pattern are plotted in Cartesian format at six arbitrarily selected times as normalized auxin concentration vs. the angle ϕ = ωt, where t ranges from 0 through a few τ. Only one third of the generative circle is graphed, since each third is the same. Note that the equations provide auxin concentrations over a range of ϕ for each value of ωt. Here, the forward wave starts at ϕ = 0 and the backward wave starts at ϕ = 2π/3. The successive values of normalized time ωt represented by variously colored lines but also labeled with values for ωt, are indicated beside the plots. The waves meet at ϕ = π/3; afterward there is build up of auxin concentration which peaks at the end of the wave propagation interval of τ + T2.
