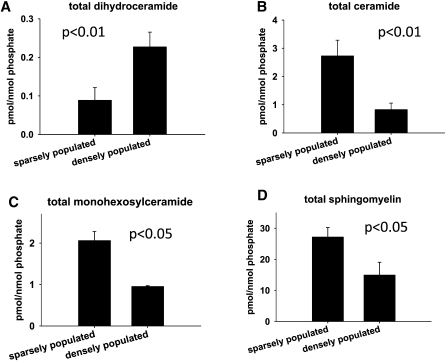
Fig. 2.
MS analyses of cellular sphingolipid levels at low and high cell densities. SMS-KCNR cells were cultured at low (50%) and high (90%) cell densities. Cells were collected 48 h later; lipids were extracted and sphingolipid levels were determined by LC/MS analyses. Sphingolipid levels were normalized to cellular lipid phosphate. Error bars represent four independent experiments. (A) Dihydroceramide. (B) Ceramide. (C) Monohexosylceramide. (D) Sphingomyelin.

